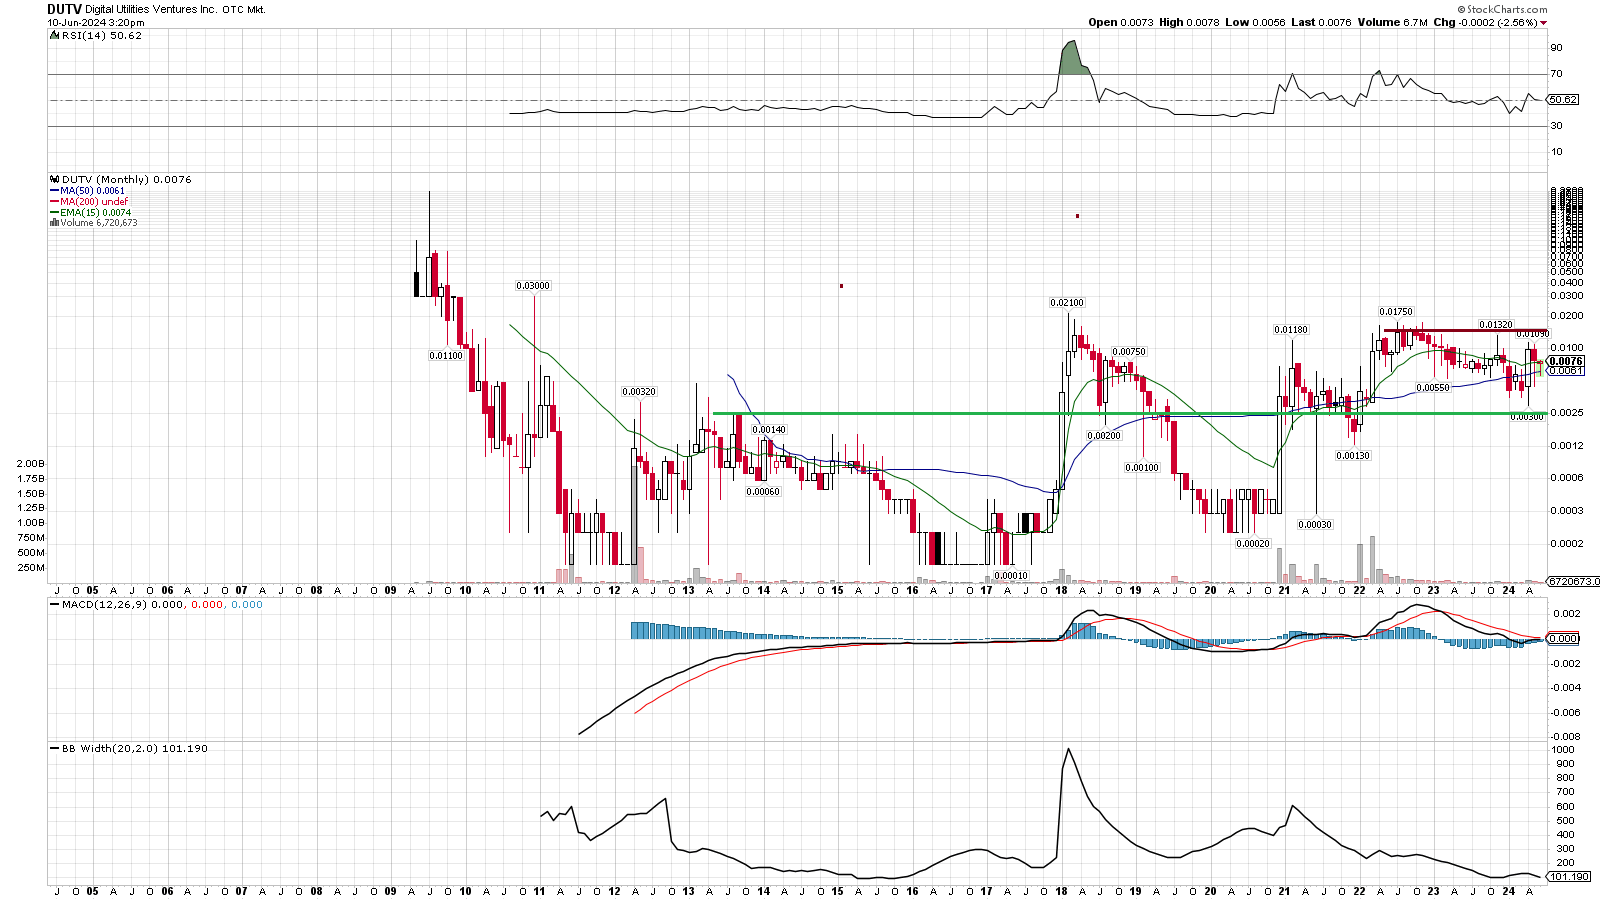
At the core of every #OTCSET play is a specific chart pattern which I’m looking for, so with that in mind I find all of my SET plays via a chart scanner, namely Scanz. If you’re interested in checking it out that’s a referral link and for the record I’ve been a happy customer of theirs since 2006 when they were called MicroCapTrader and then later renamed EquityFeed. That said, you don’t need any software to find #OTCSET charts. This is my calling and I fully plan to share everything I find. My X account is where I will post about and share my watchlist as well as provide updates on the ones I’m following the closest. I believe I can help bring the best chart setups to the forefront and with other’s help I think we can find the ones which also have the best fundamentals behind the chart.
My goal has been and continues to be to thoroughly scan the entire OTC for any chart that meets the specific criteria I am looking for, namely a long base (ideally 5+ years if not longer) followed up by a strong volume backed breakout to new long term highs (above said 5+ year base) and has since formed a higher low (vs it’s pre-breakout base). I maintain one gigantic main watchlist with every ticker that could possibly fit this criteria and then have a separate watchlist for what I consider the cream of the crop. The main watchlist is nearly 200 tickers and growing so the latter is what I focus on and continually refine.
The longer the base, the better. A breakout of a 10 year base is better than a breakout of a 5 year base and tends to have bigger implications. The higher the post breakout correction stays, ie the higher the higher low is, the better. The smaller the correction from the highs means the less it has to move up to then retest it’s key ceiling level and potentially trigger a secular bullish continuation signal. The less it has to move up to test it’s ceiling, the less overbought it will be when the bulls and bears battle for control over that secular ceiling (and hopefully then turn the resistance into a new support level). The less overbought it is when it arrives at that pivotal level, the better odds for the bulls to win out.
I will do my best to highlight what I believe are the best examples of this pattern and in turn the best potential opportunities based on the inherent strength in the chart, and subsequently the potentially easier path towards successful mergers and sustainable growth. Follow my X account as this will be my main focus for the foreseeable future. What I would like others to do is share their due diligence and dig into what I believe are the best charts and help find the ones with the most compelling narrative and/or fundamentals. If we can successfully connect the strongest charts with the most intriguing stories, strongest management and fundamentals behind the charts, I firmly believe we’ll put ourselves in great position to potentially yield major returns during this upcoming bull market.

