If the historical standard for an OTC chart is a long term/ secular downtrend, ie lower highs and lower lows for years if not decades, then we’re looking for the exact opposite of that.
The #OTCSET is the antithesis of the perpetually downtrending OTC chart, so the first thing I am looking for when I am adding to my #OTCSET watch list is something that made a new 5 year higher high within the last 5 or so years. There can be some variance but at the bare minimum there can’t be a secular downtrend strongly in tact. Many of these will have their secular high ceiling in 2021 but not all of them.
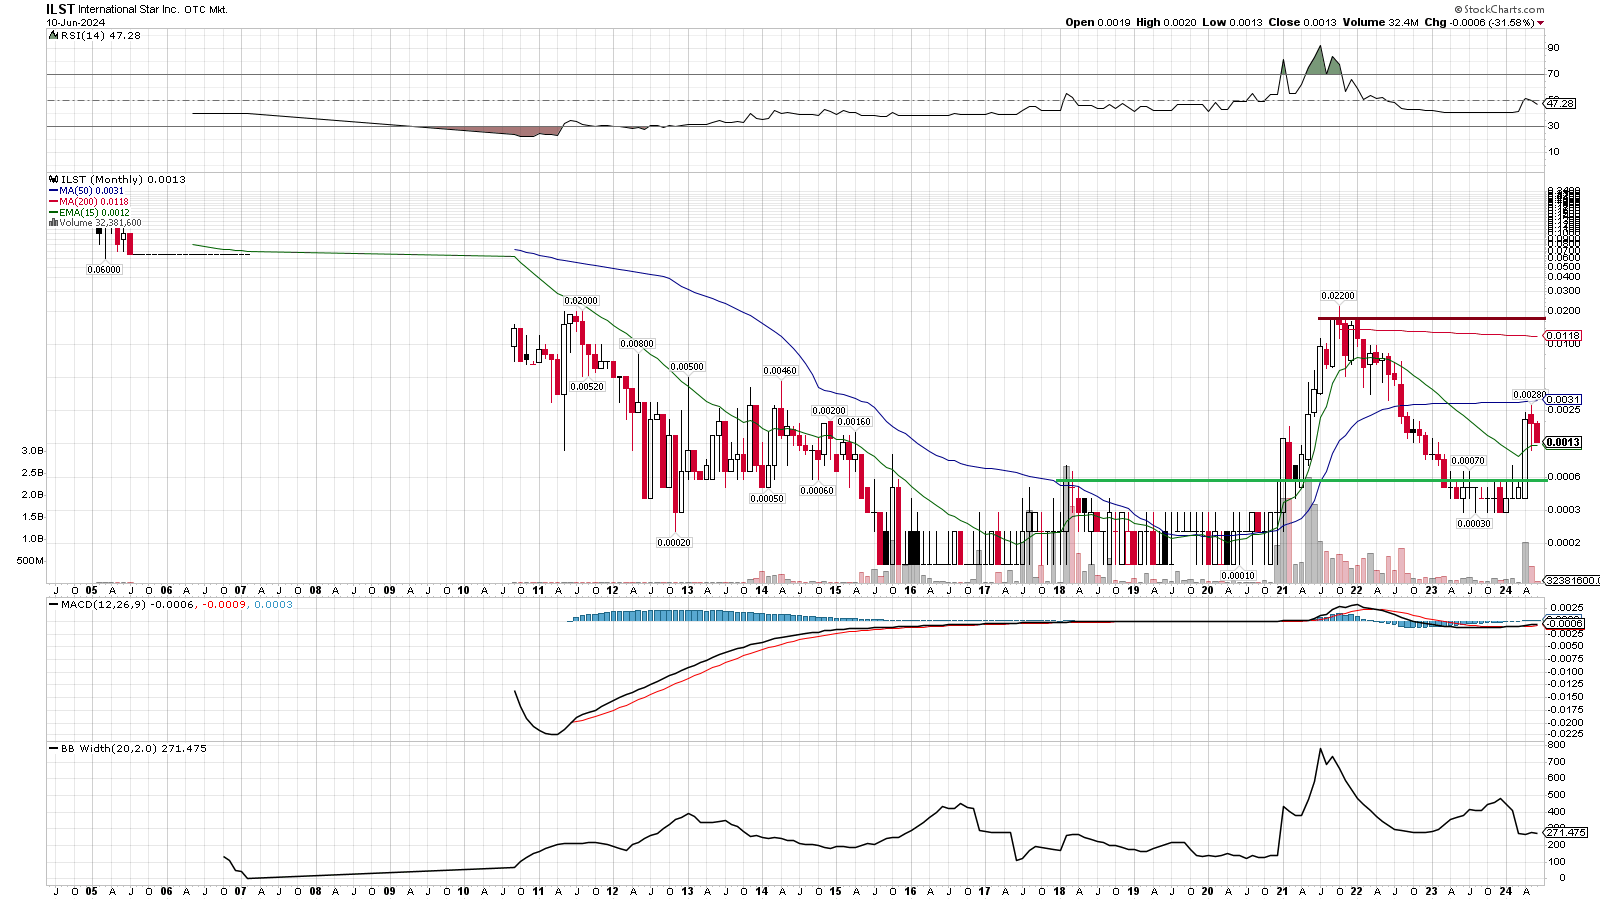
Here’s one example:
The rally in 2020 made a new long term high, then again it made a new secular higher high in 2021. The high point in 2021 ended up forming a new 7 year high. The 2+ year correction during the OTC bear market erased much of those gains, as happened with most of these shell/merger plays, but since then it also formed a secular higher low. The 2023 low was higher than the pre 2020 lows and in fact bounced off of the pre 2020 ceiling.
It may not seem overly obvious, which is actually good, but the chart above is in a secular bullish trend. Breaking the ceiling on that chart (and any chart like it) opens the door for all sorts of possibilities that OTC stocks very rarely get to sniff.
In essence this chart highlights what to look for in an #OTCSET chart setup.
- Long basing period, ideally 5+ years of relatively sideways trading
- Significant breakout of that base, often occurring in 2020/21 era, to new long term highs
- Higher low during the recent 2.5 year bear market correction vs the pre-breakout base
Before I do any due diligence and consider anything else, these are the conditions I am looking for. There are many different forms this general theme may take, and in many cases we’re looking at tickers which were delisted for quite some time, so don’t get too hung up on one specific look. We’re looking for the lack of a secular downtrend and as much confirmation of a secular uptrend as possible.
We can talk about the fundamentals, narrative, the sentiment and all of that good stuff, but this theory is ALL about the charts first and foremost. It’s the strong long term trends that are adding value to these shells as much as anything. A perpetually downtrending chart has massive resistance and sellers to eat through to move it’s price up but these strong secular trending charts offer up a much cleaner path towards a strong uptrending stock price and real liquidity. That’s why a private company is going to want to merge with a strong #OTCSET chart over one stuck in a long term downtrend, it offers up the best path for raising capital into strength and therefore is going to be more attractive to legit businesses.
My theory within the theory is that the nicest charts with the strongest secular trends will ultimately get married to the nicest stories/fundamentals. It’s not that I don’t value the fundamentals, I definitely do especially if we’re talking swing trading or investing in any of these shells/mergers, but without the underlying chart telling me the bulls have a potentially very favorable path for them I just can’t trust the fundamentals/story/sentiment.
I’m compiling a list of virtually every OTC ticker which made a new 5+ year high over the past 5+ years, has made a higher low since it’s last secular peak, and then from there making a further refined list of my favorite of all of those (there are too many otherwise). That list of my top watchers is what I focus on and will do my due diligence on, and ultimately the plays I focus on will be the ones with the nicest charts and the best due diligence to go with those charts.
When I say nicest charts, I mainly am referring to the ones with the largest bases which precluded the breakouts as well as the ones with the shortest distance to travel to hit it’s respective secular high/ long term ceiling. A stock breaking to a new 15 year high is sending a stronger technical signal than a stock breaking to a new 5 year high. As far as the distance to get back to it’s long term ceiling and the next potential breakout trigger point, the less it has to rally to get there the less overbought it will be when it comes time to battle the resistance level. If you can find a setup that broke out of a very long term base (10+ years), you’re looking at a potential monster. The closer it is to it’s secular high and long term ceiling, the better the odds are that the monster will wake up.