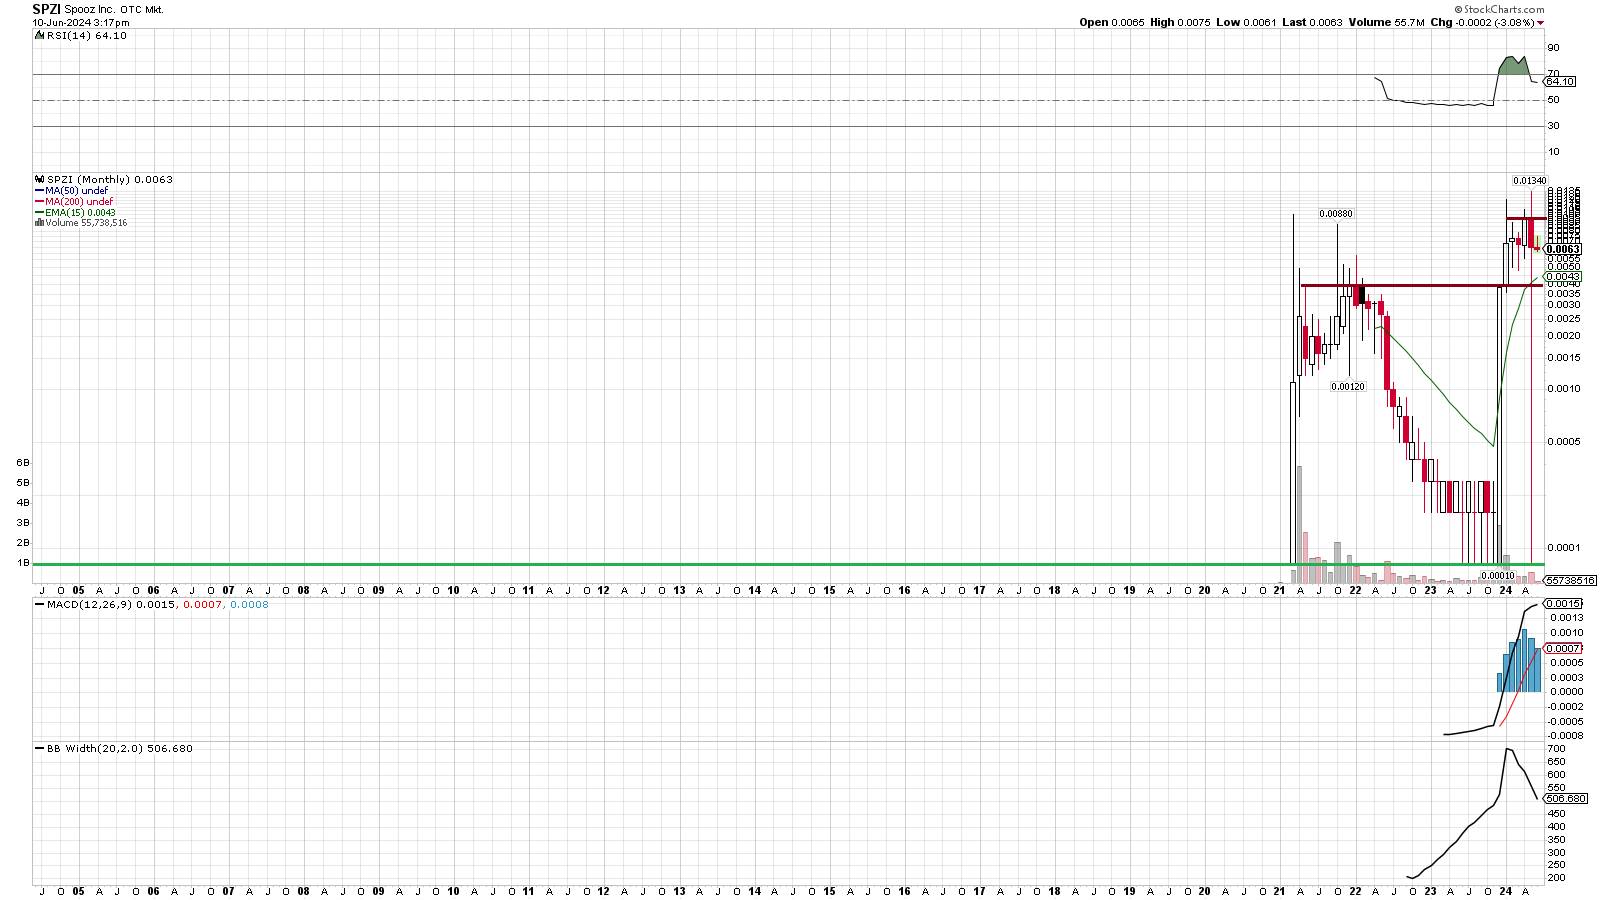
Let’s assume that all of the criteria I look for in an #OTCSET chart pattern is there in spades. What next? The chart is overarching structure of the entire thesis, but now to fill it all in comes the narrative and fundamentals.
Why owns the shell? What stage of their journey are they in? I refer to these as shells because that is where their value lies. Even if there’s a segment or segments bringing in revenue, that doesn’t mean they won’t still use the shell itself to add more value via mergers, acquisitions or joint ventures of some sort. They can call it a lot of things but in essence these are bridges for private companies to access US capital markets.
Is the current owner looking to sell the shell or is he/she running the ship themselves? What is this person’s track record when it comes to these sort of mergers and acquisitions? Ideally you want to find the SET chart patterns that are also connected to the highest quality of directors, but again in theory the latter should have an affinity towards the former because the strong charts are going to be the best vehicles for growth, hence they will be targeted by smart directors.
The underlying school of thought is that through these strong chart patterns we’re looking for the best opportunities to catch the next Deep Fucking Value play. The plays where the hedge funds and market makers all decided they were going to zero but ultimately they survive, grow and then one day thrive. Basically we’re trying to connect the strongest charts with the strongest turnaround stories, and not only will one attract the other but they will help provide a self reinforcing cycle.
The strong chart attract the strong growth story and quality management, then the strong growth and quality management help further strengthen the chart. The stronger the chart and market for these shells in general, the better odds the management has at long term success because they can raise capital at advantageous prices and liquidity situations.
There’s a lot to explore and dive into when it comes to what to look for on the fundamental side. The management, the merging companies and the stuff like the share structure are all important factors. Those things in turn have a ripple effect which then taps into other key elements like the liquidity and sentiment for a stock. In a perfect world we’re looking for all of these elements in one, and in theory those should be tied to the best probabilities of finding the next Deep Fucking Value play. Finding them all in one play may seem like finding a needle in a haystack, but my entire theory is predicated on my belief that the strongest and cleanest charts will act like magnets for the best fundamental conditions for success (ie the best odds), and that the strong charts I’m presenting all stem from the idea that capital began flooding into these shells in 2021, took a long break to reset the market and are now is ready to further flood the market and take these shells to new levels well beyond their 2021 era highs.

