My theory suggests that the 2021 bull market in the OTC was just wave 1 of a bigger picture move and that most (if not all) of the shells which rallied back then got way ahead of themselves in a white hot pumped and bloated market. I also believe the 2.5 year bear market since then doesn’t signify the end of this story, it was just a necessary phase for the market to fully reset itself and re-fertilize the proverbial soil. Now the shells which were overbought and expensive in late 2021 are cheap and ready to be bid up again, especially as the floats are almost certainly held in fewer strong hands now and the speculative market keeps getting hotter in other US risk assets.
As the market becomes more accommodating for mergers and acquisitions, it will spark even more demand for these shells as companies rush to access all of the capital flooding in. If 2021 was just wave 1, then it’s reasonable to wonder if wave 2 sees even more capital and even higher highs. There’s a self-reinforcing cycle here at work as the better any of these shells/mergers do, the more demand is sparked for other shells, the more capital flows in making mergers and acquisitions more and more attractive. Even just the value of a clean but empty shell likely has to go up substantially as this cycle plays out and the theory proves more and more true.
So where does my conviction come from? Why do I so strongly believe these shells still hold potential value and many of the 2021 runners can not only revisit their secular high water marks, but also break through and squeeze to new long term highs? Why do I believe 2021 was an unprecedented bull market in the OTC and represents something even bigger is occurring when you step back and appreciate the wider picture?
Let’s take a moment to breakdown what an OTC chart historically tends to look like over a long period of time.
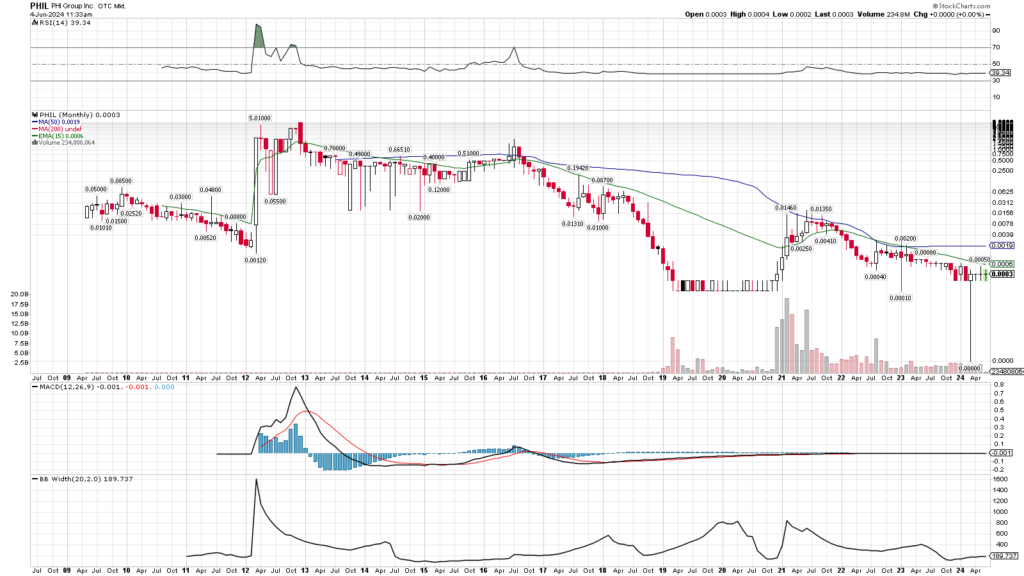
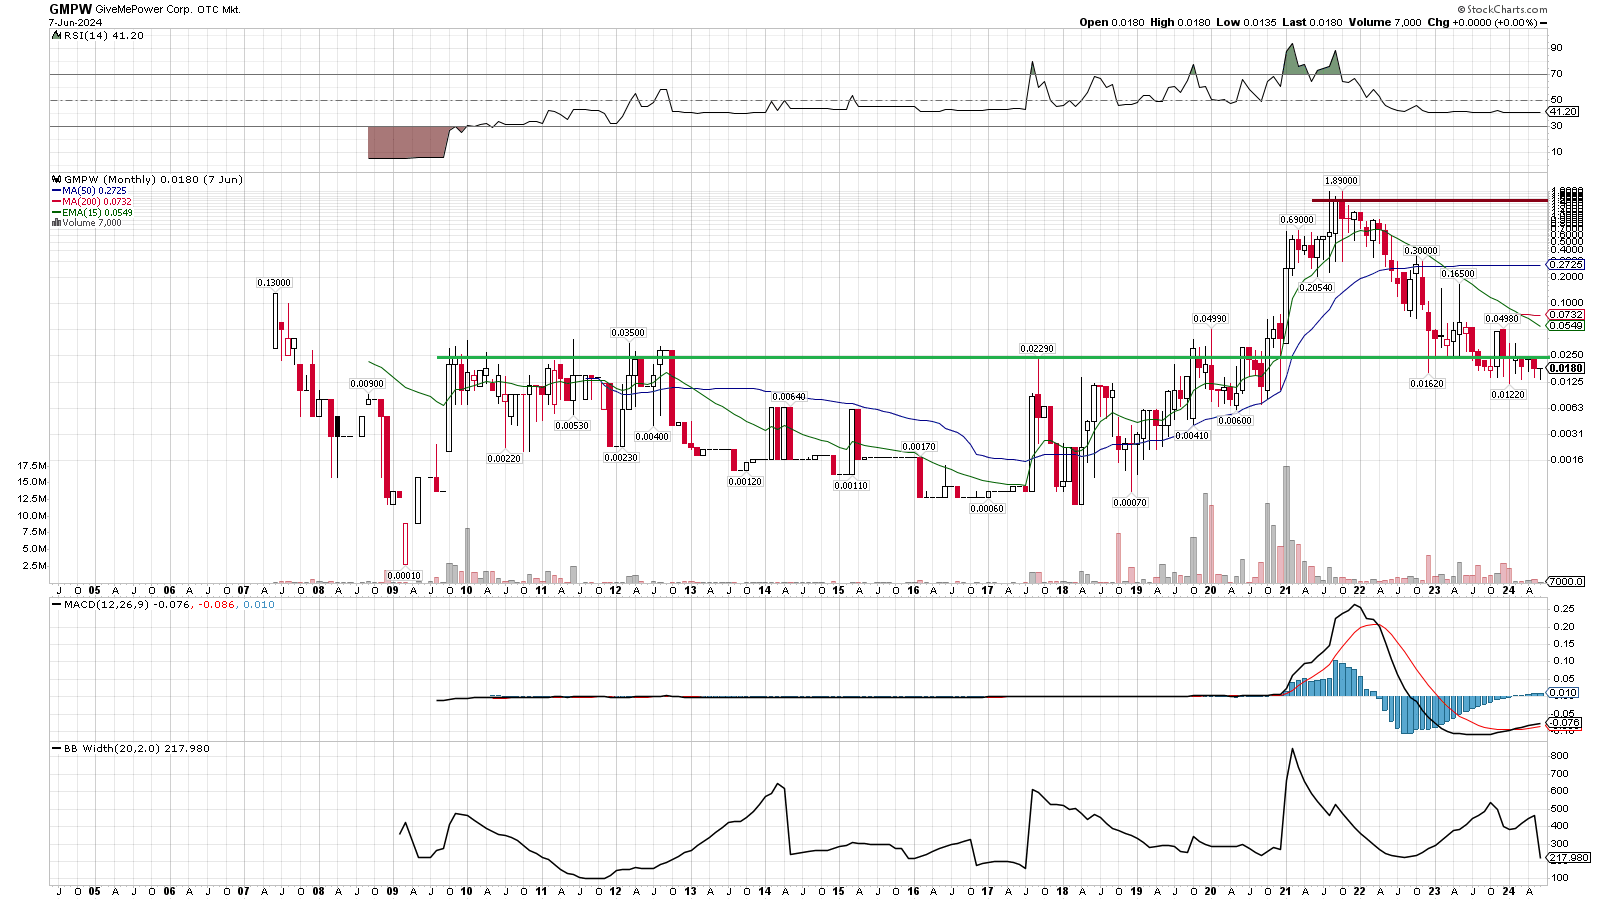
What I want to highlight is that through the years this stock has had some very big rallies and bullish phases, but every single one of them since 2012 ended up being a lower high than it’s last rally and those eventually paved the way towards a new lower low. In my nearly two decades of trading, this has been the crux of almost all OTC runners. Sure they get red hot at times, but if you hold them too long you often ultimately ride the death spiral to perpetual lower lows. In the rare event that an OTC runner is making secular higher highs and higher lows, the odds are pretty good it doesn’t belong in the OTC (and is making strides towards an uplisting).
All this is to say, historically if you hold an OTC too long, your odds are quite good that the trade will end up quite bad.
The long term trends matter much more than most can begin to appreciate, especially because the OTC is largely made up of inexperienced traders with no clue of what they’re doing, and the experienced traders often tend to focus on much shorter time frames.
So this is where the 2021 great OTC blowup makes things interesting. The chart and description above highlights the norm for the OTC historically, that they rarely will make a significant long term (say 5 or more years) higher high, yet in 2021 I saw and noted hundreds of OTC charts which did just that. That has never happened before but it wasn’t until much later though that I started to see the bigger picture and why that was and is such a significant event to be aware of and not dismiss.
If your standard OTC stock historically is perpetually forming lower highs and lower lows on each of it’s cycles, what does it mean when suddenly more charts make secular higher highs at once than ever before in the history of the OTC like they did in 2021? Was it indeed just a one-off event or was it the opening chapter of a bigger picture event taking place? The Dollar Milkshake Theory postulates that there’s lot of global liquidity looking to find a way into the US capital markets and my OTC Special Event Theory believes that these shells are in the process of being flooded with this global tsunami of capital. 2021 was just the first wave of the flood, the second wave could be even bigger.
2021 in the OTC was unique not just because so many stocks ran hard at roughly the same period but because so many did so and in the process made secular higher highs. If you weren’t looking for it (you have to zoom way out to see that, and remember most traders aren’t doing this), you wouldn’t even notice that so many of the 2021 rallies made such meaningful new long term highs. Most traders in the OTC aren’t factoring in this time frame and don’t know enough to even consider what the long term trends tend to be on OTC stocks or why that’s critical here.
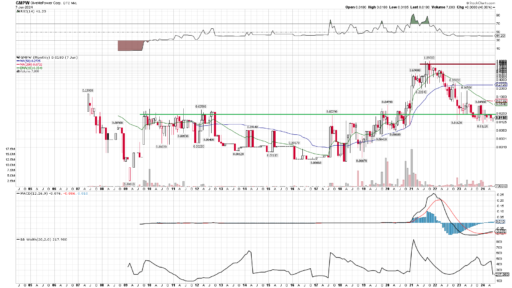
It’s not unusual for an OTC stock to have two major rallies in a 3 – 5 year period, but what is very rare is when the second rally eclipses and holds above the first rally, then builds upon it. $SPZI is one of if not the first OTC ticker to begin to confirm my Special Event Theory because it’s one of the first to test, break and (so far) hold above it’s 2021 peak (which was already a new secular higher high itself). Let’s break down that chart and what makes it stand out, as well as what to look for moving forward.
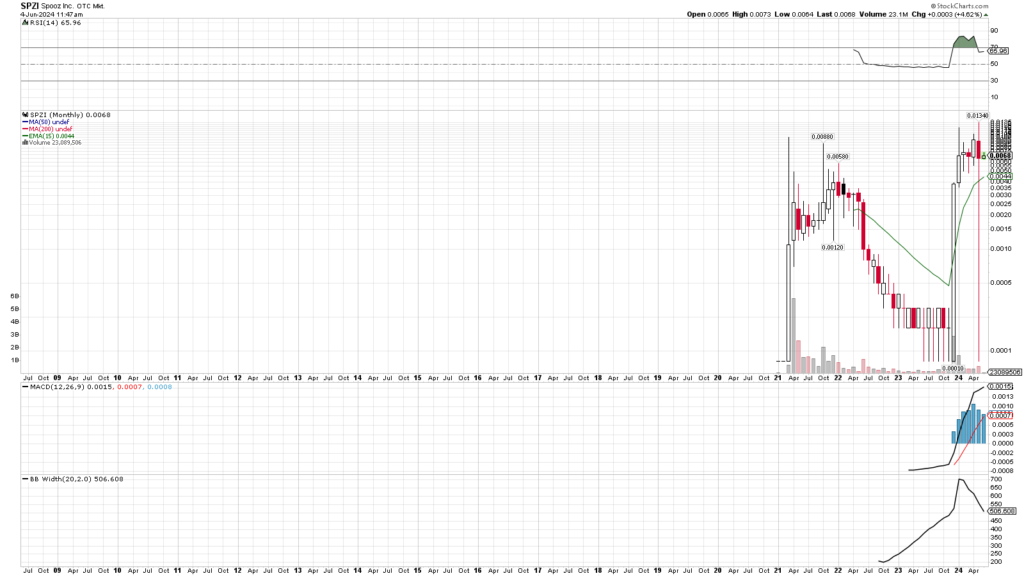
After a very lengthy period of being delisted, $SPZI came back during the great OTC cleanup of 2021 where it broke out and made new long term highs – which admittedly isn’t hard to do when you don’t trade for well over a decade.
My belief is that the 2021 secular bullish triggers/signals, especially because there were so many of them, were a sign of a longer term uptrend/breakout occurring within the realm of OTC shells. With that said, the confirmation of that (and my whole theory) won’t come until the prior secular higher highs are indeed broken (on many of the tickers). That’s why $SPZI is such an important stock right now because it’s done the unthinkable. Not only did it break out to a new long term high in 2021, but then it came back after the bear market correction and has begun to build a new base above that prior peak. That’s the key – taking out the last meaningful secular high (which itself should be a secular higher high point).
It may not seem like a huge deal, especially because the price has stayed mostly range bound on $SPZI now for a number of months, but this is an epic bullish/continuation signal that you just don’t see on your standard OTC pump and dumps. I can’t stress it enough, historically it’s a never ending game of lower highs and lower lows from one rally to the next every few years or so. New secular higher highs isn’t a quality normally associated with OTC runners. That’s what made 2021 special and why I think it has implications well beyond just what played out back then, and why $SPZI is quite important and has the potential to lead an army of secular uptrending OTC stocks to an unprecedented phase the OTC has never seen before. That being said, though it’s broken through it’s last secular higher high, it still has to continue to battle and build a new base around this level, not fall back too far and ultimately get squeezed to much higher levels as the fundamentals and the story all continue to develop. That will be the key for this one and that will be the key for any #OTCSET play that wants to fully exploit the strength of their respective secular bull trends. Can the fundamentals perpetually improve to help steadily fuel the technical strength?
At this stage my theory is still very much just a theory, but for the past 1.5 years it’s dawned on me more and more. The 2021 hype was all about the mergers and that narrative isn’t dead just because retail moved on, in fact the retail market moving on is exactly what the overbought and bloated shell market needed. The bullish signals from 2021 were very significant, but trends and signals on this time frame are counted in months and into years. The first wave was a doozy and lasted upwards of a year+ for some runners, but every wave has a counter wave and correction. The question is were the secular bull signals good for just one wave or are the biggest moves still to come? Spoiler: I created this website just so I could write about this so I think you know my answer.
$SPZI was the first ticker to do what I was thinking some/many would/will do, retest and ultimately break through their 2021 ceiling. For my theory to prove true however, I need to see more and more of these stocks which made secular higher highs in recent years to come back and revisit their respective ceiling, and ultimately crush through to new long term highs. The initial breakout in 2021 to new secular highs was the bullish trigger/signal/setup or whatever you want to call it. Breaking through those respective levels offers up confirmation of those signals and sparks a continuation signal on a time frame that the OTC world just won’t be able to process. It’s very possible if not likely that a bullish signal on this long of a time frame implies a bullish resolution measured in years. I think this wave will be longer in duration than 2021’s was, and if not longer it will have more violent upside in a shorter amount of time. Either way it feels wildly bullish to me, it’s just a matter of what the pace will be.
My conviction stems from the charts but it’s not a matter of technical analysis over fundamental analysis. My belief is that strong long term trends and signals like this are just reflections of underlying positive elements in the supply and demand dynamic. The charts can reveal when fundamentals, underlying market conditions, narratives or insider sentiment start to improve even before it’s overly obvious to everyone.
The charts can tip off when something big is occurring, and in this case the clue was the OTC suddenly (in 2021) producing an army of long term higher highs when historically they were rarely seen. Once you see something undeniable in the charts, then it’s time to dig in and put a story behind the price action. Something big began in 2021, but what exactly and how do we take advantage of it moving forward?