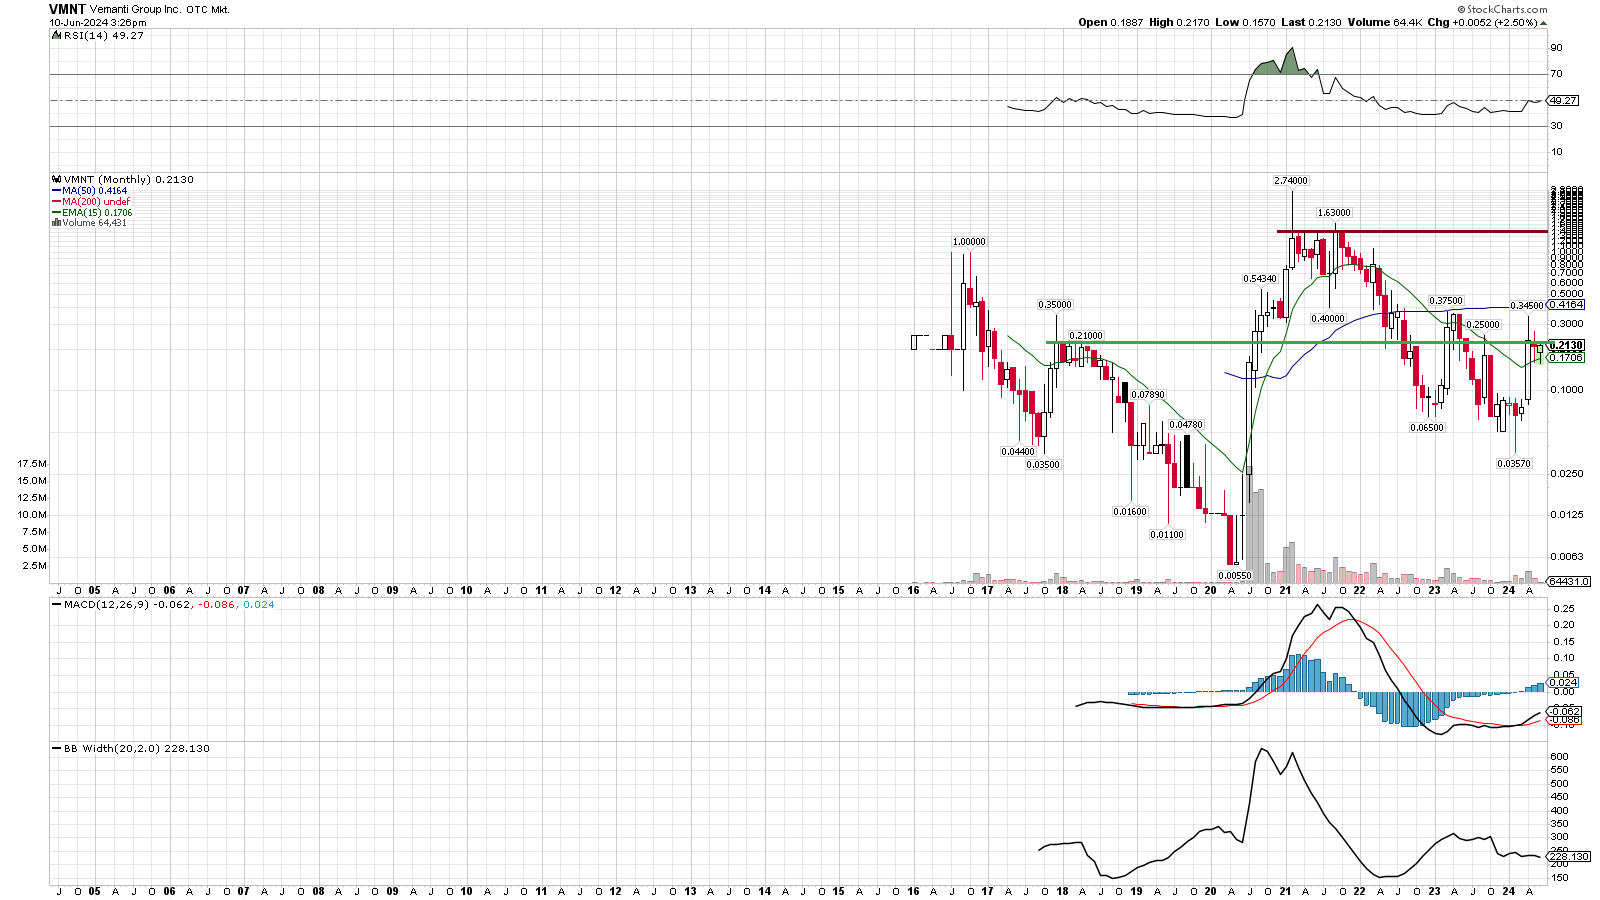
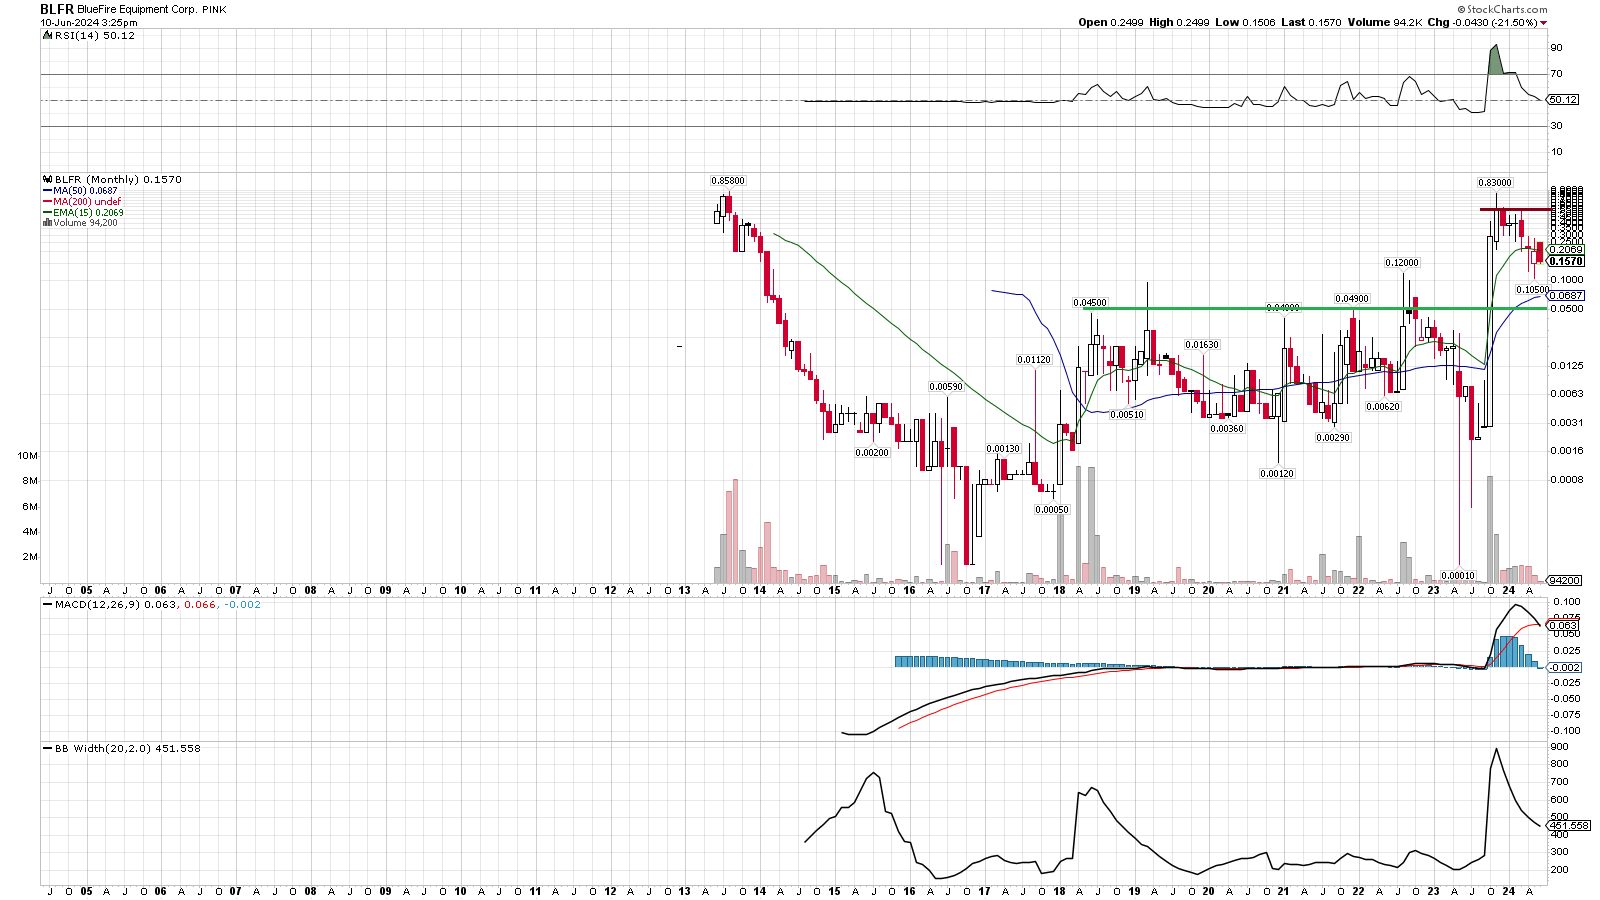
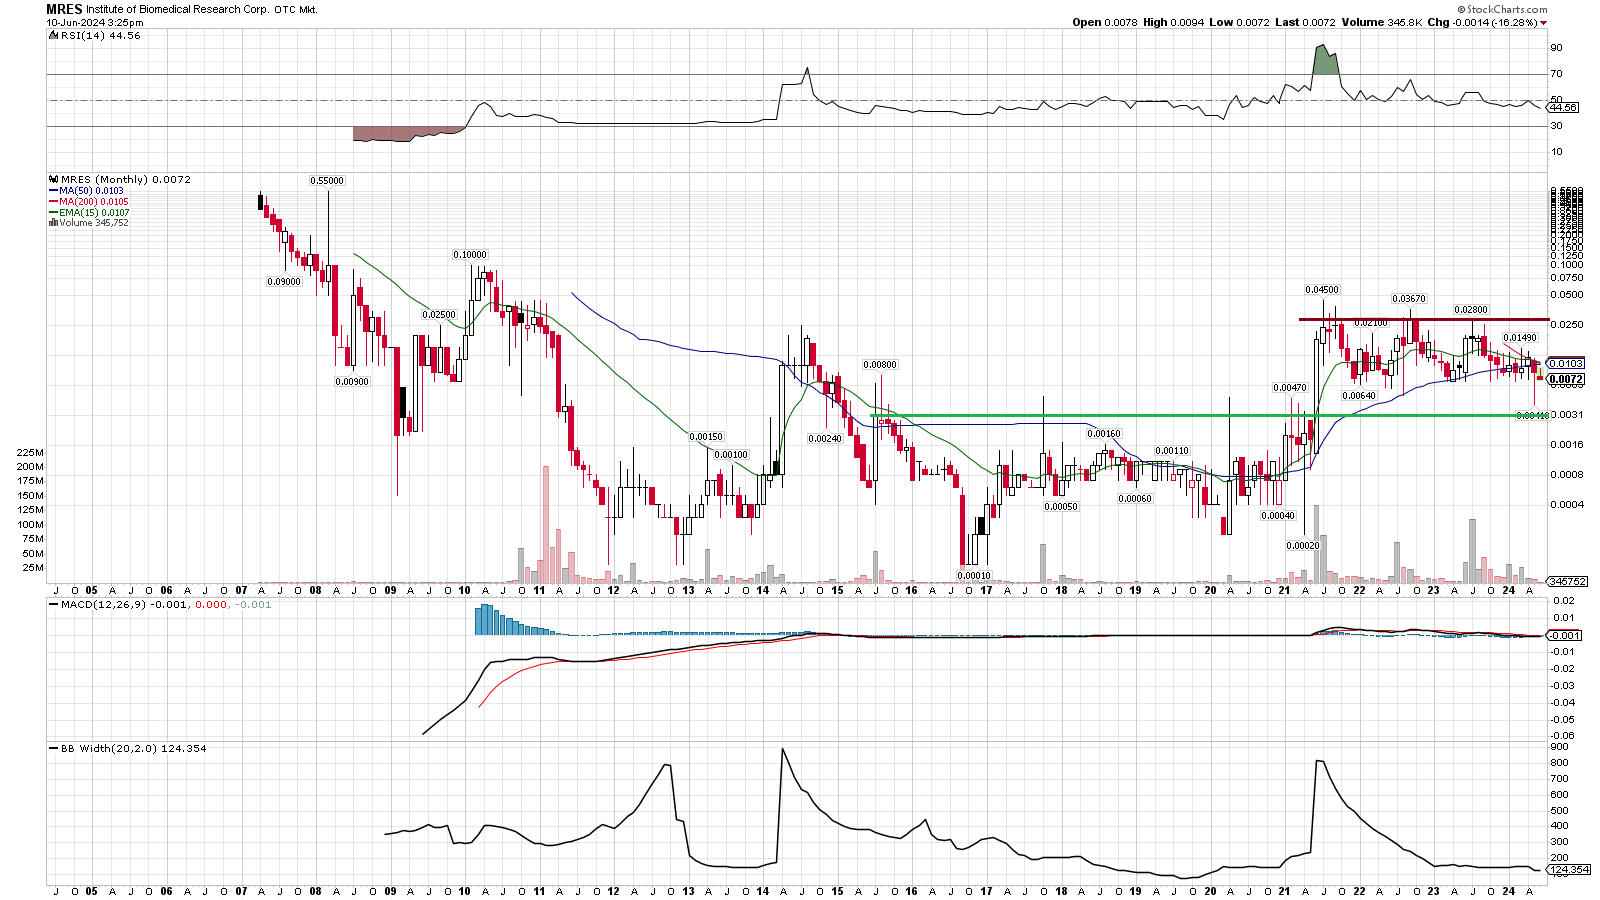
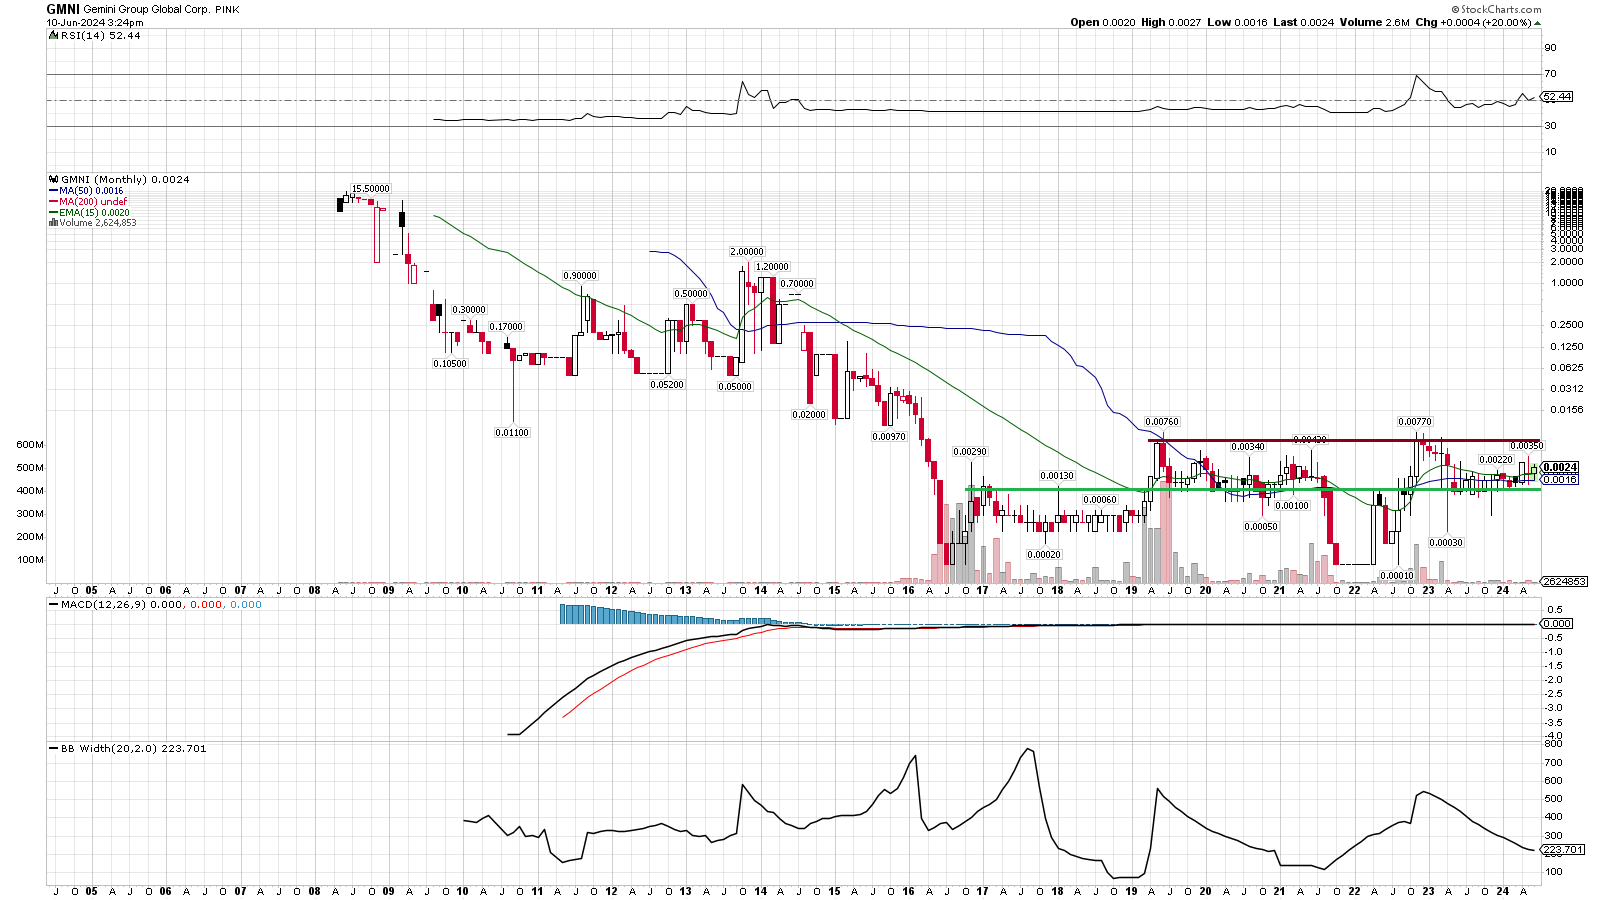
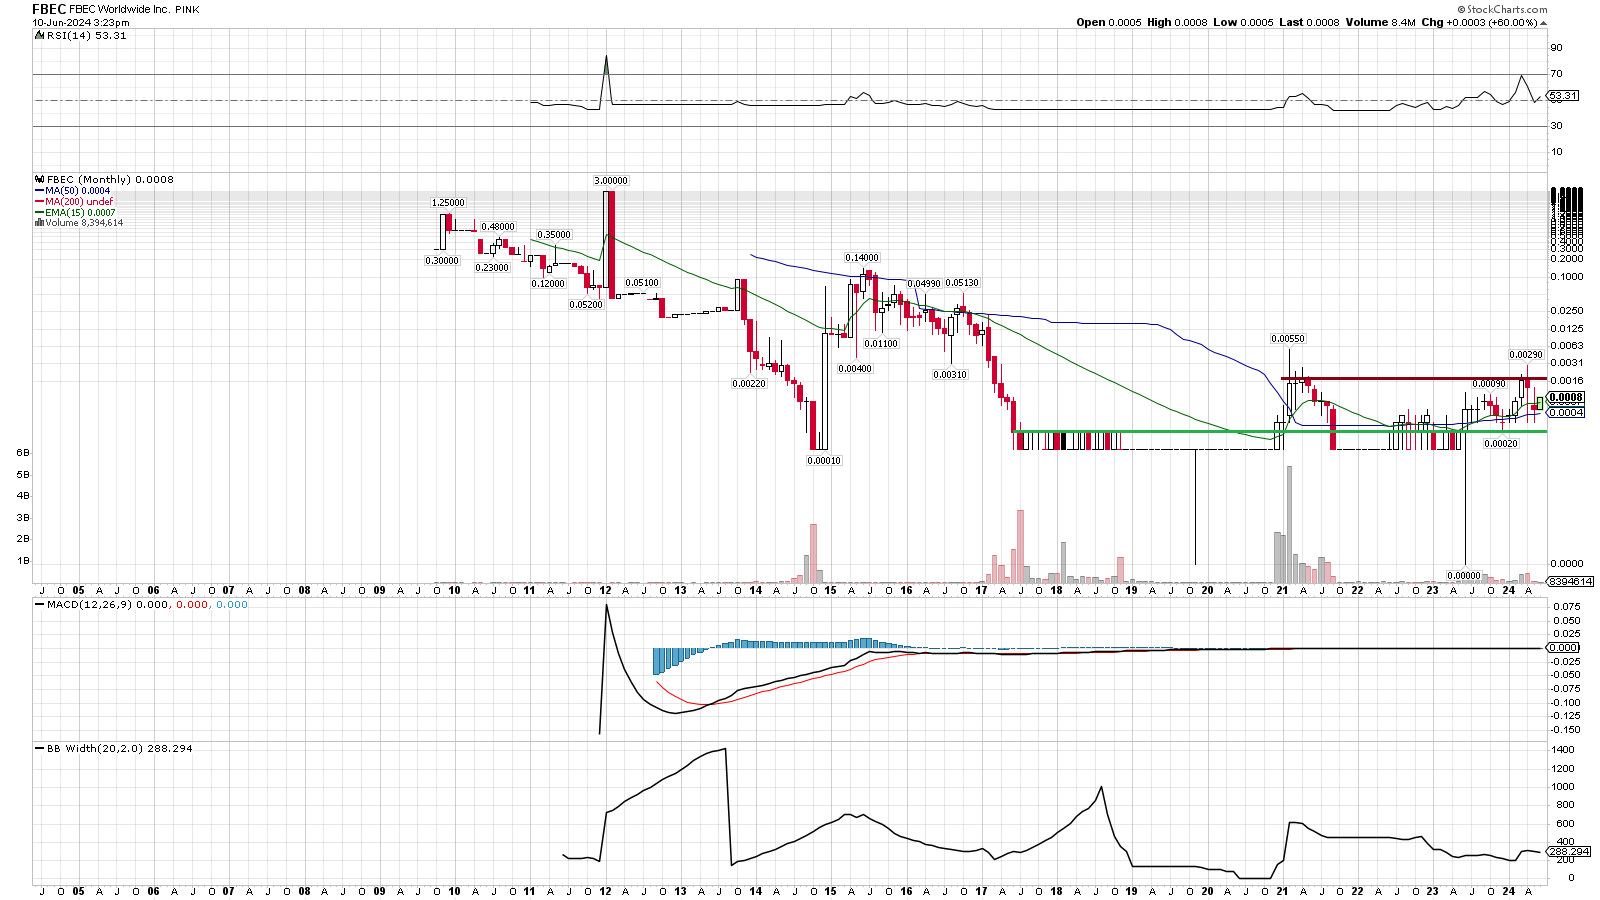
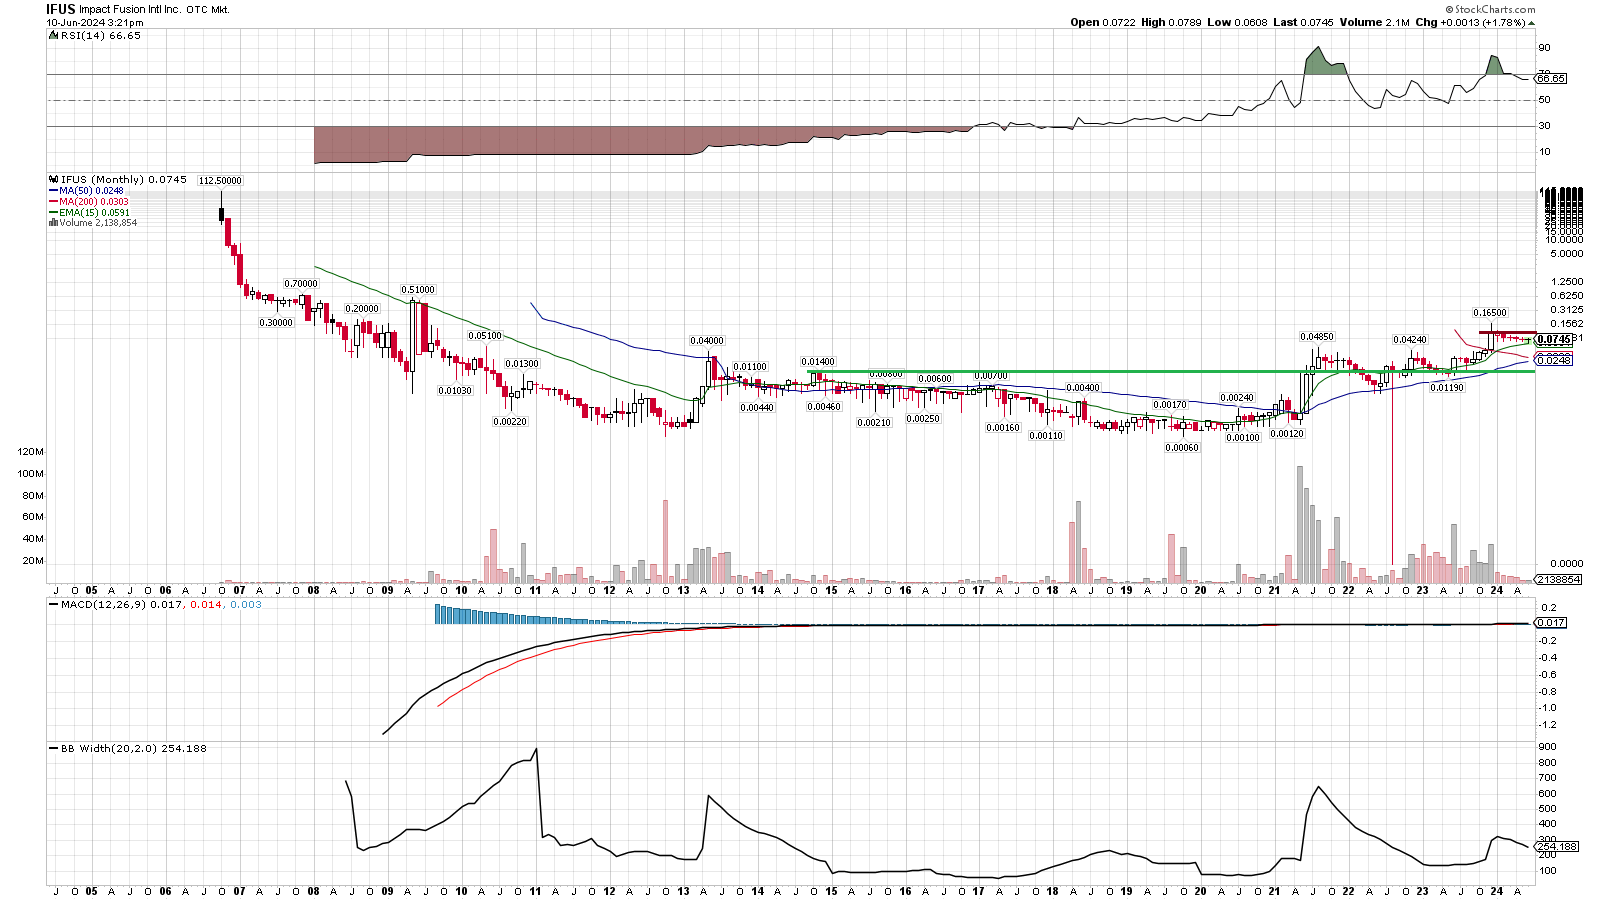
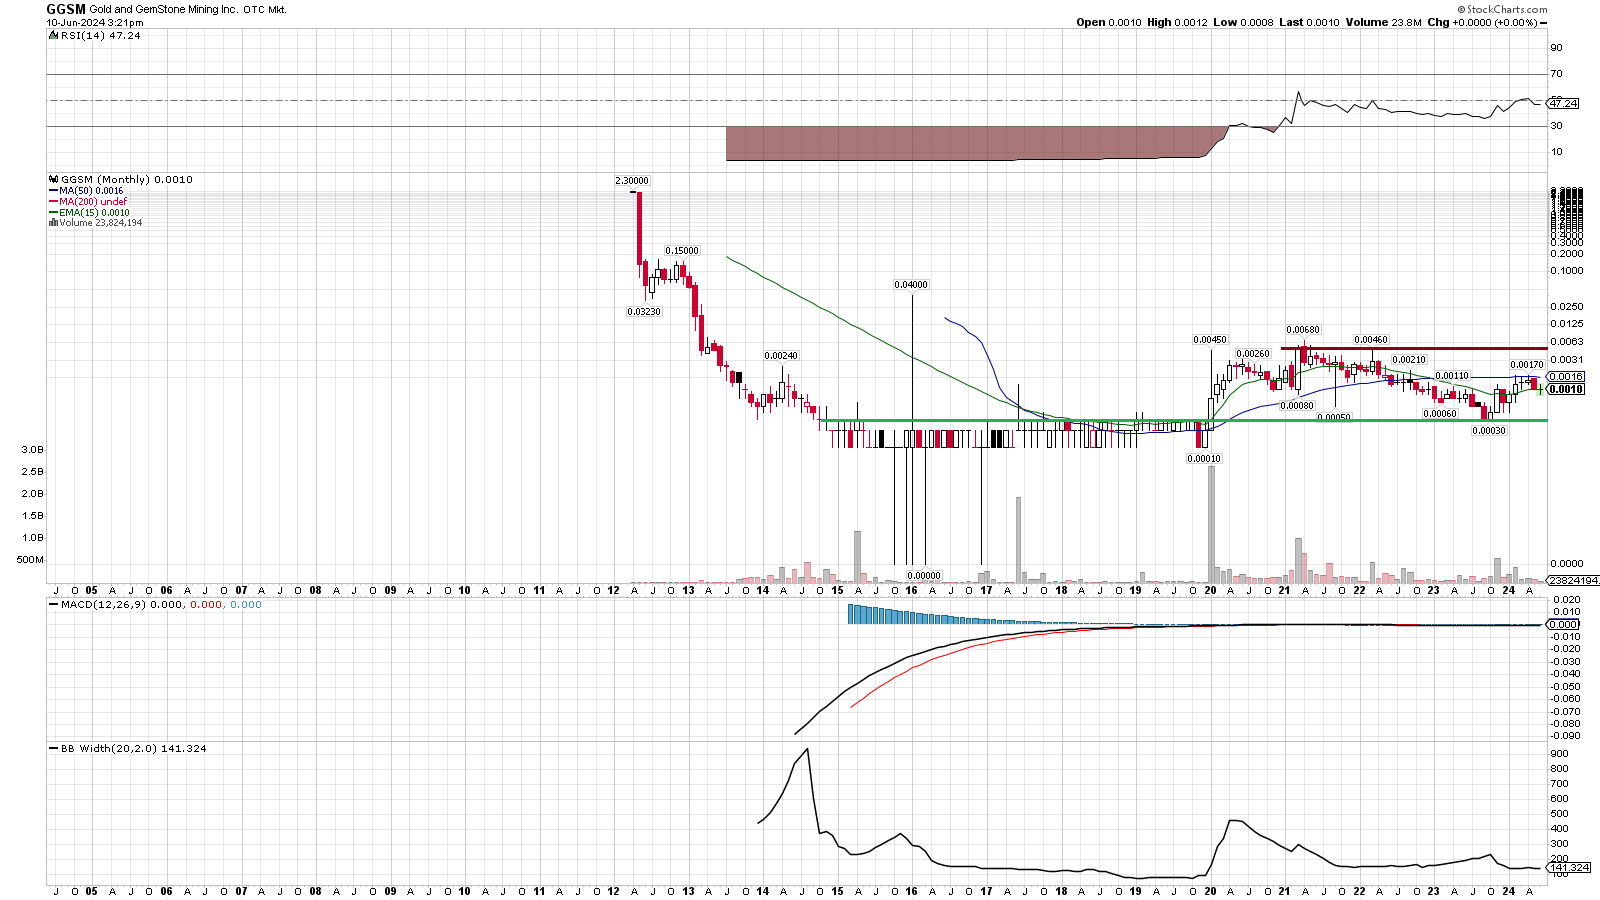
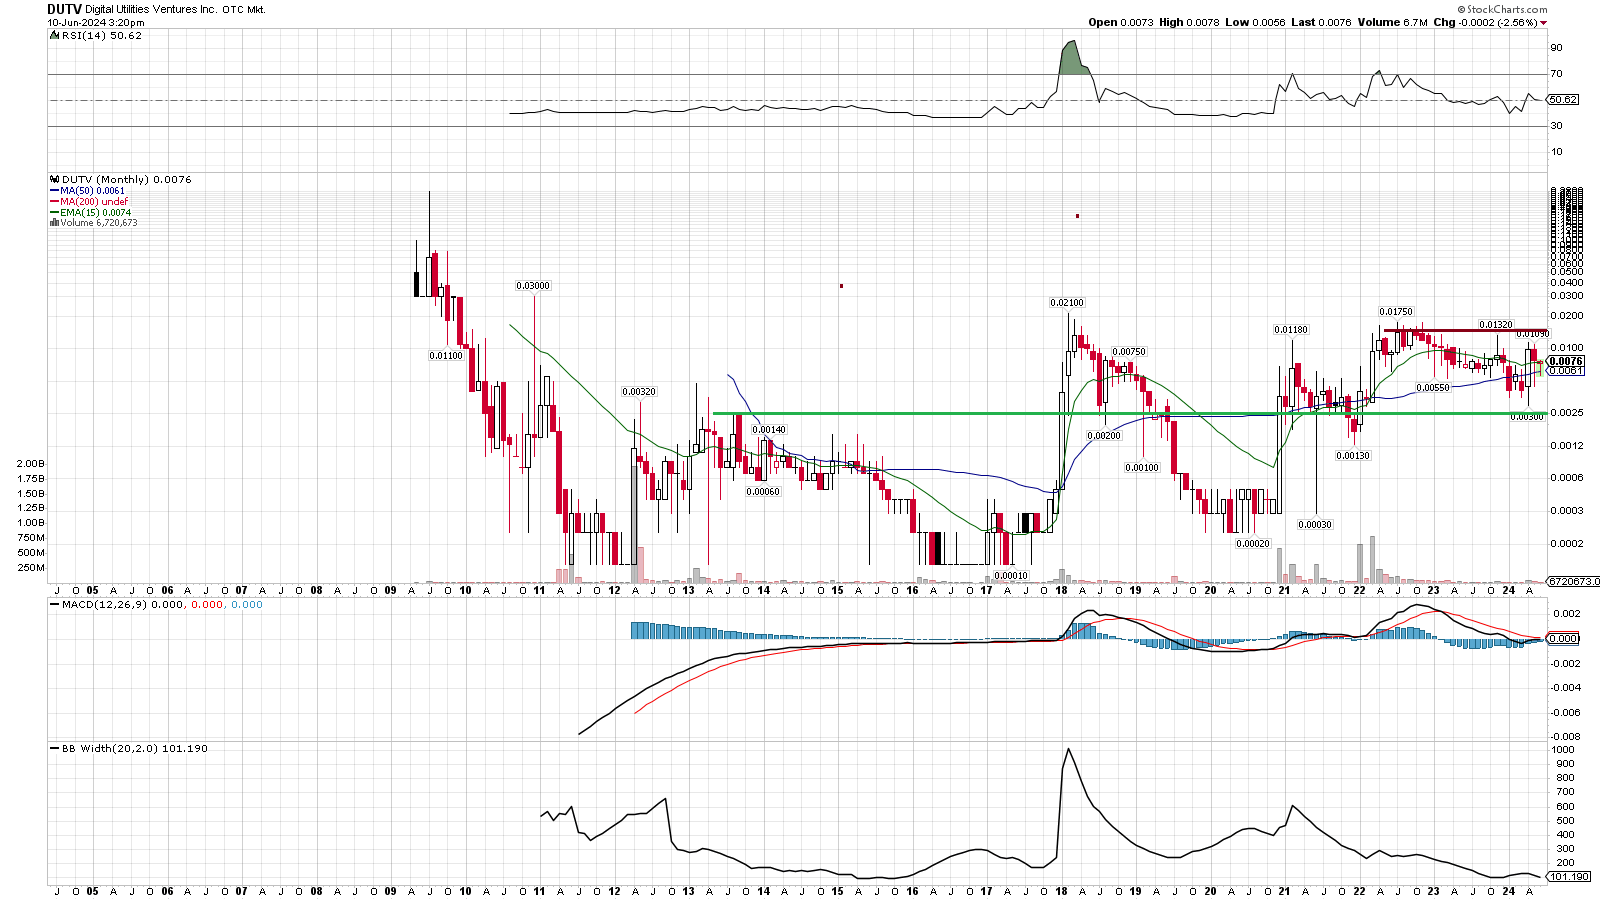
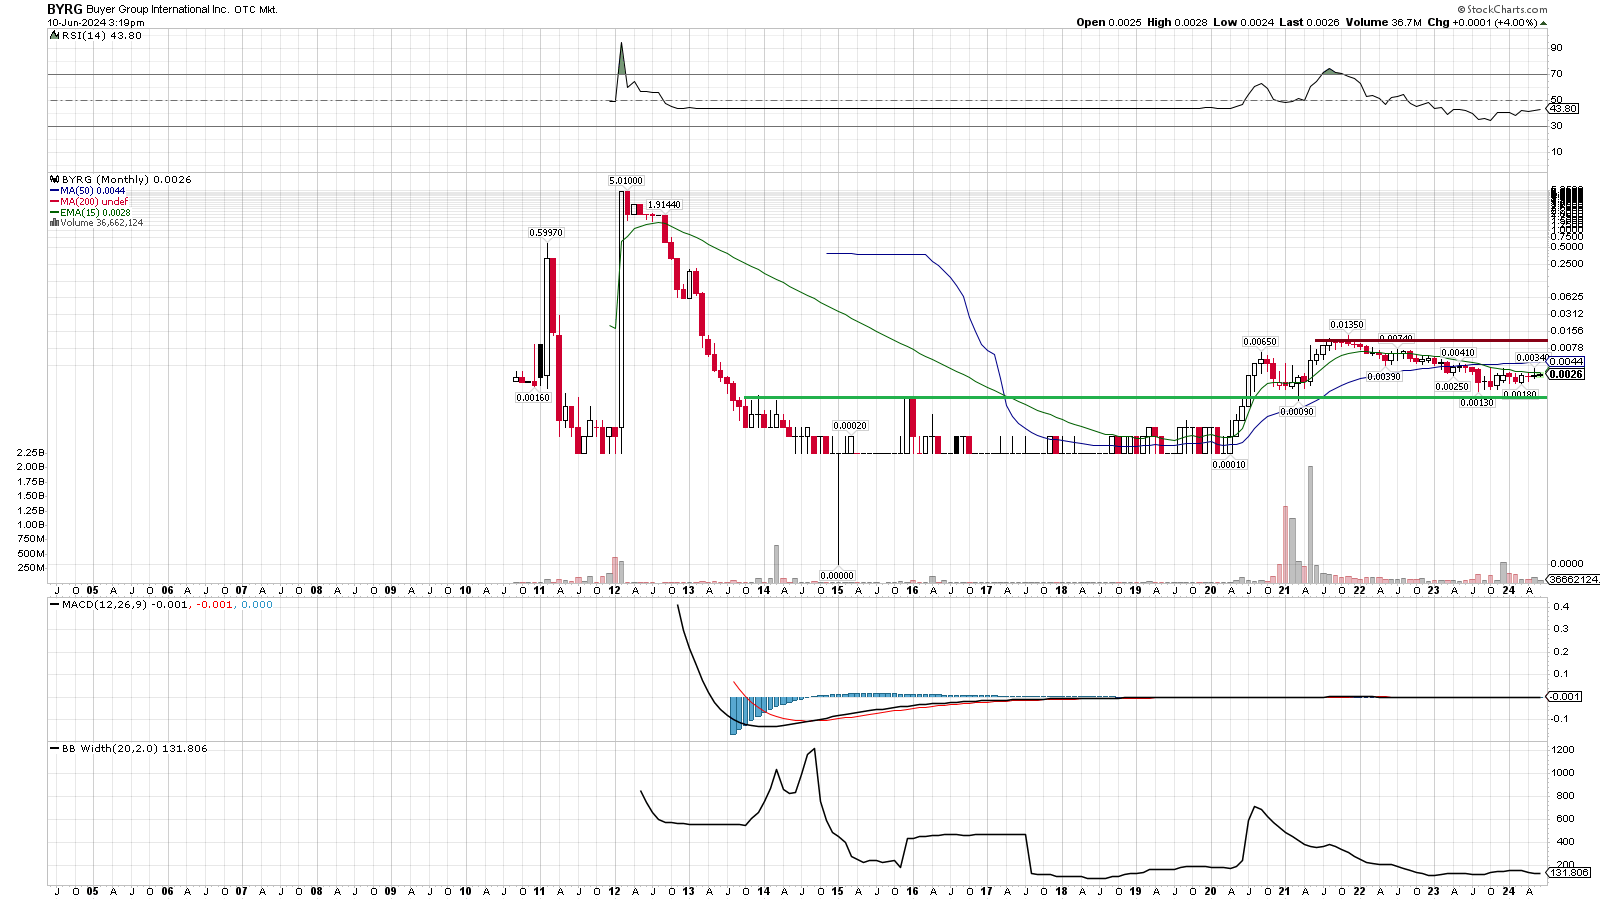
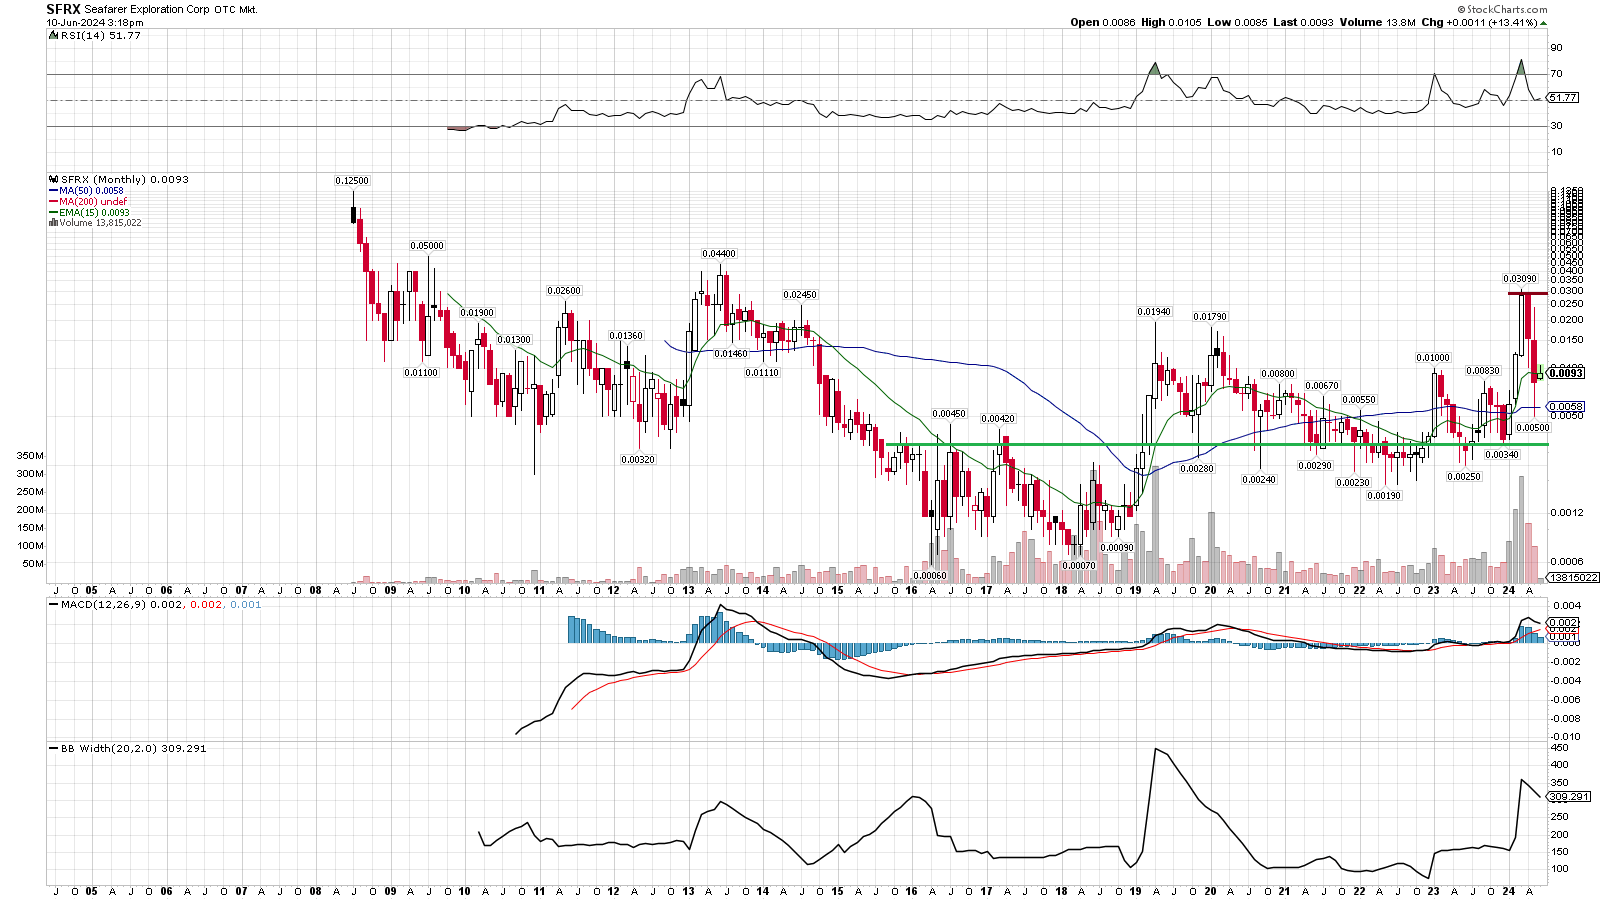
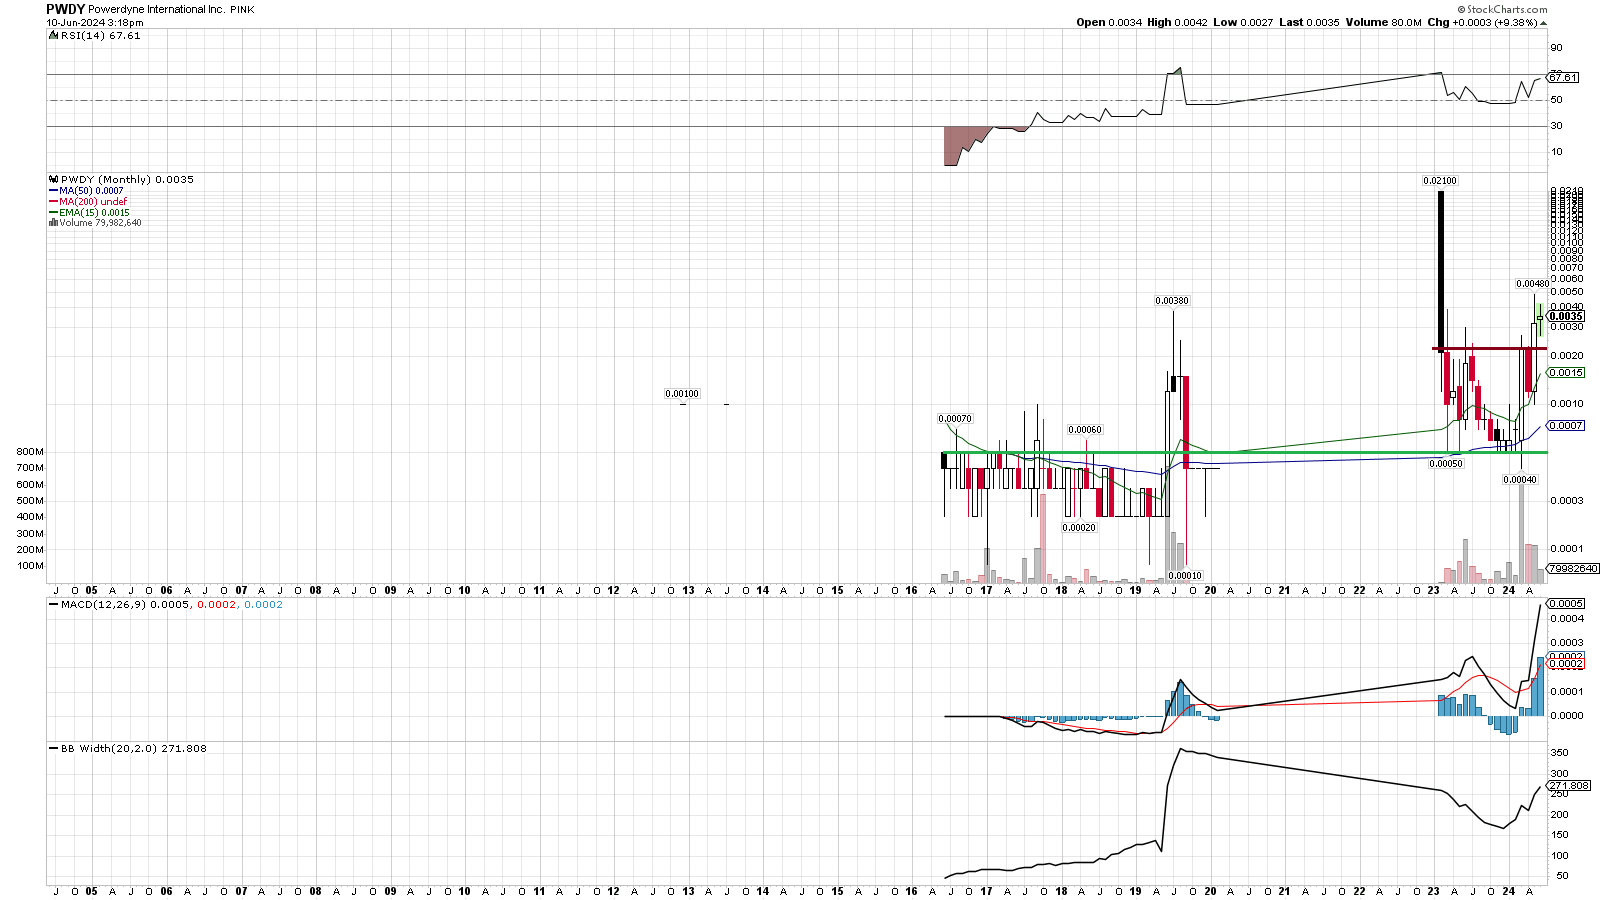
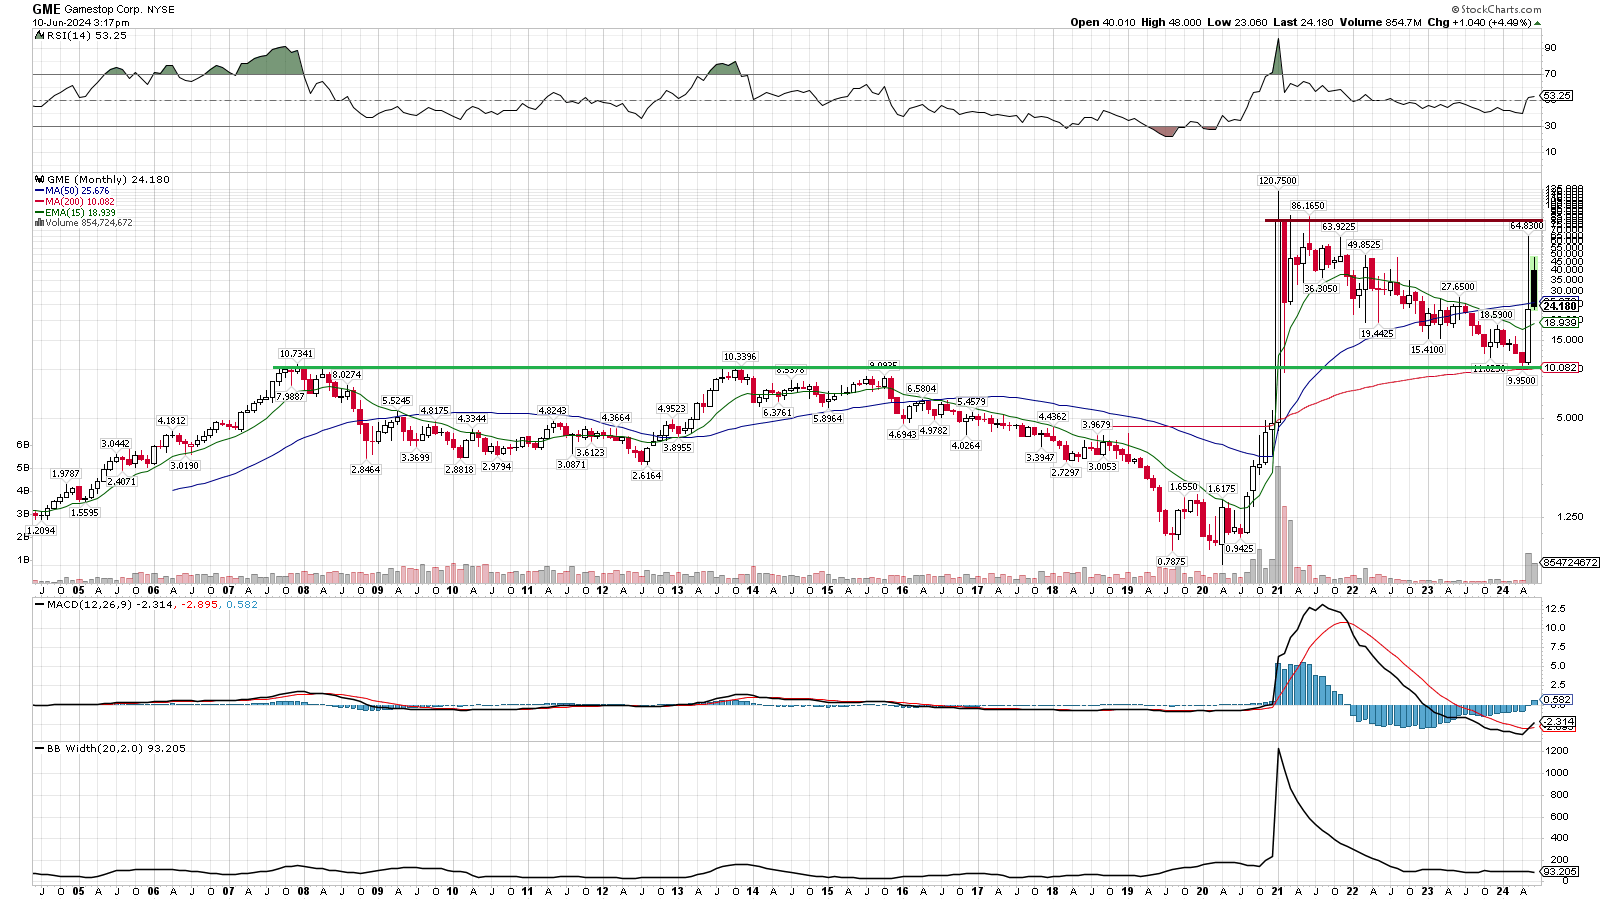
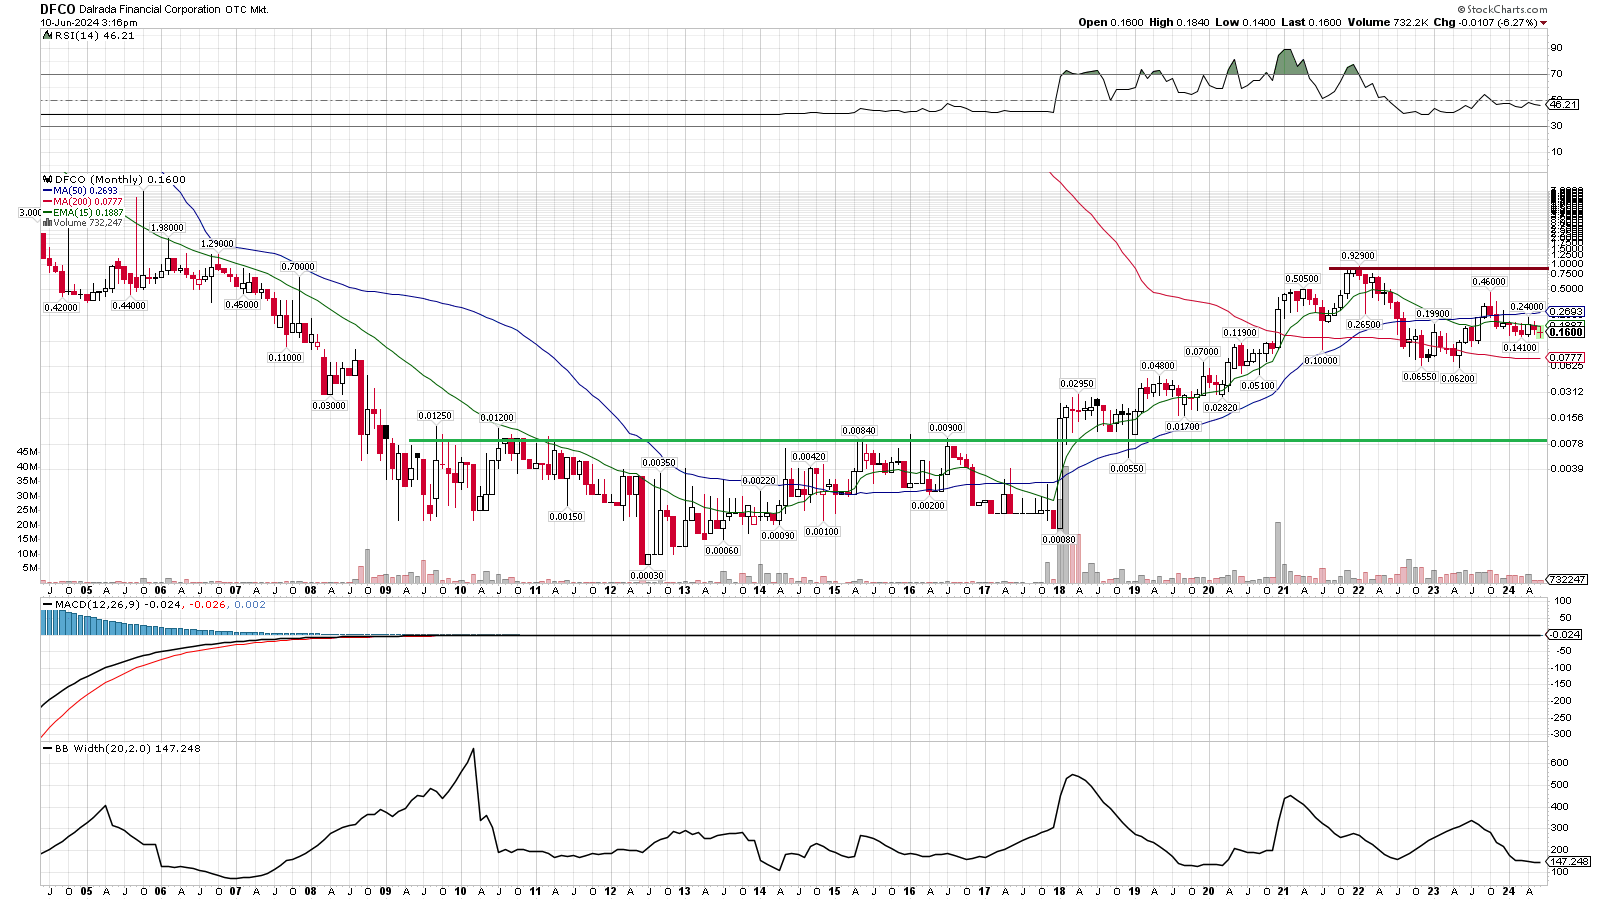
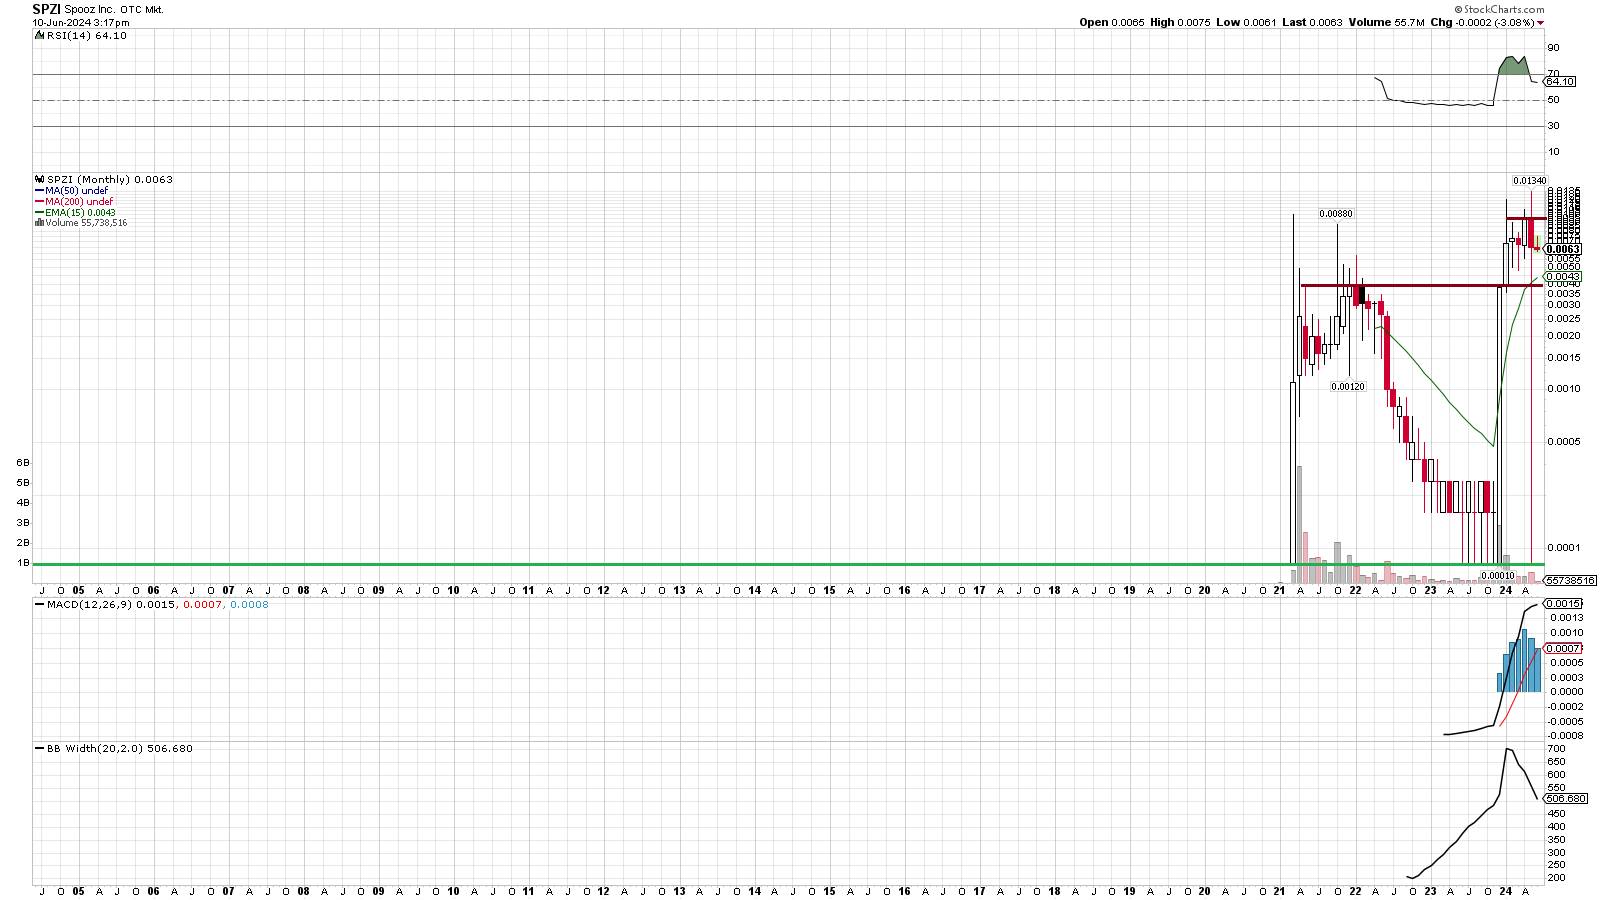
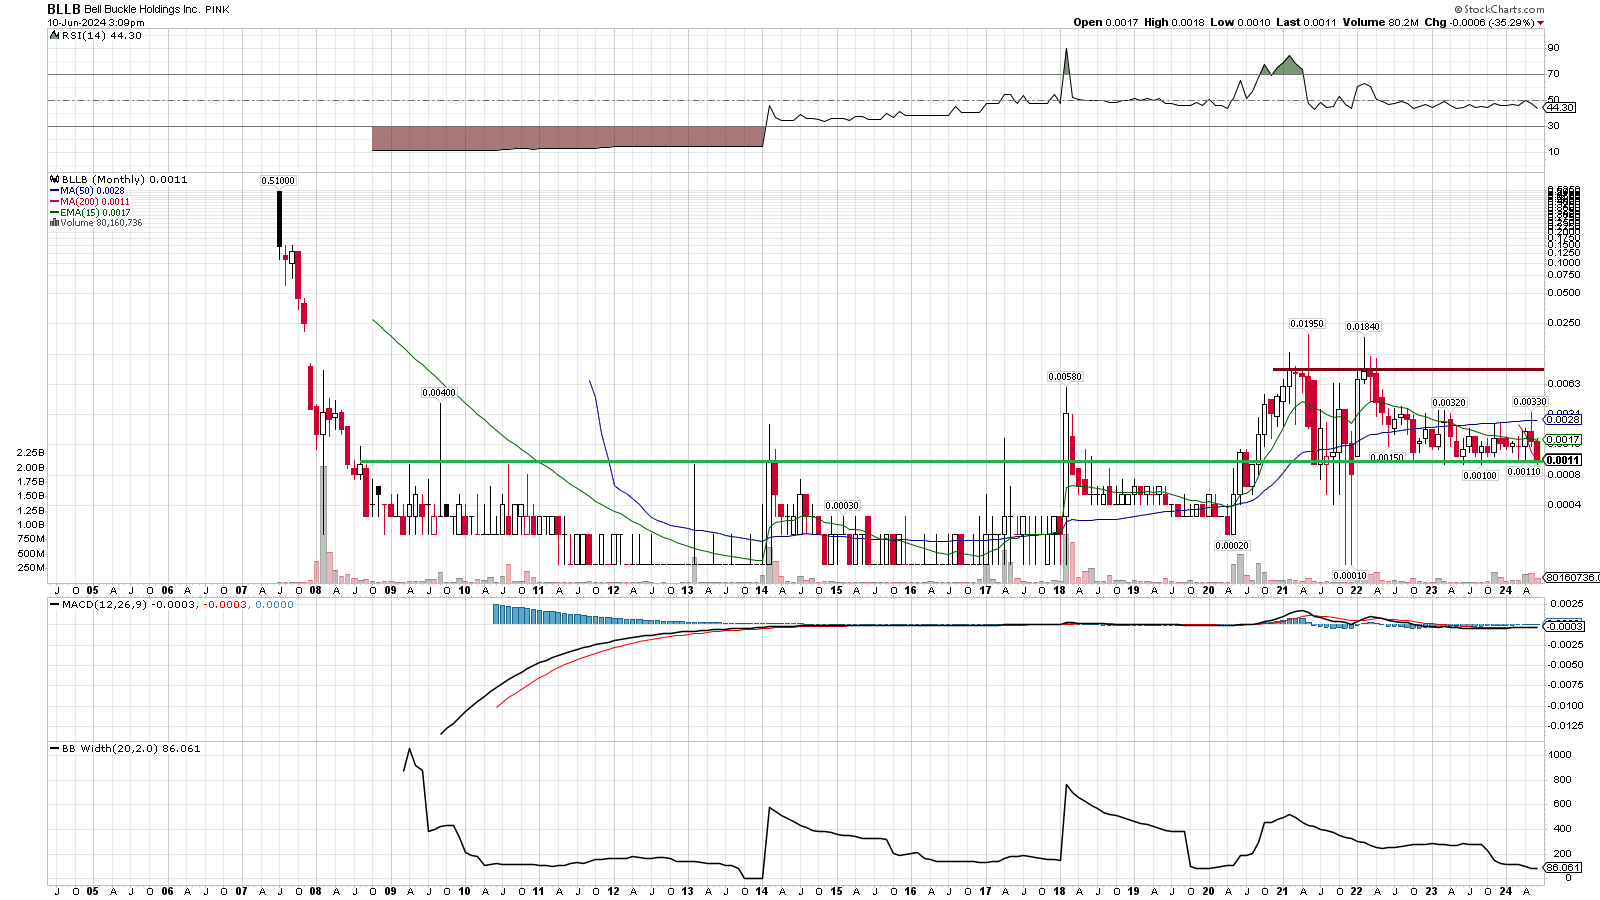
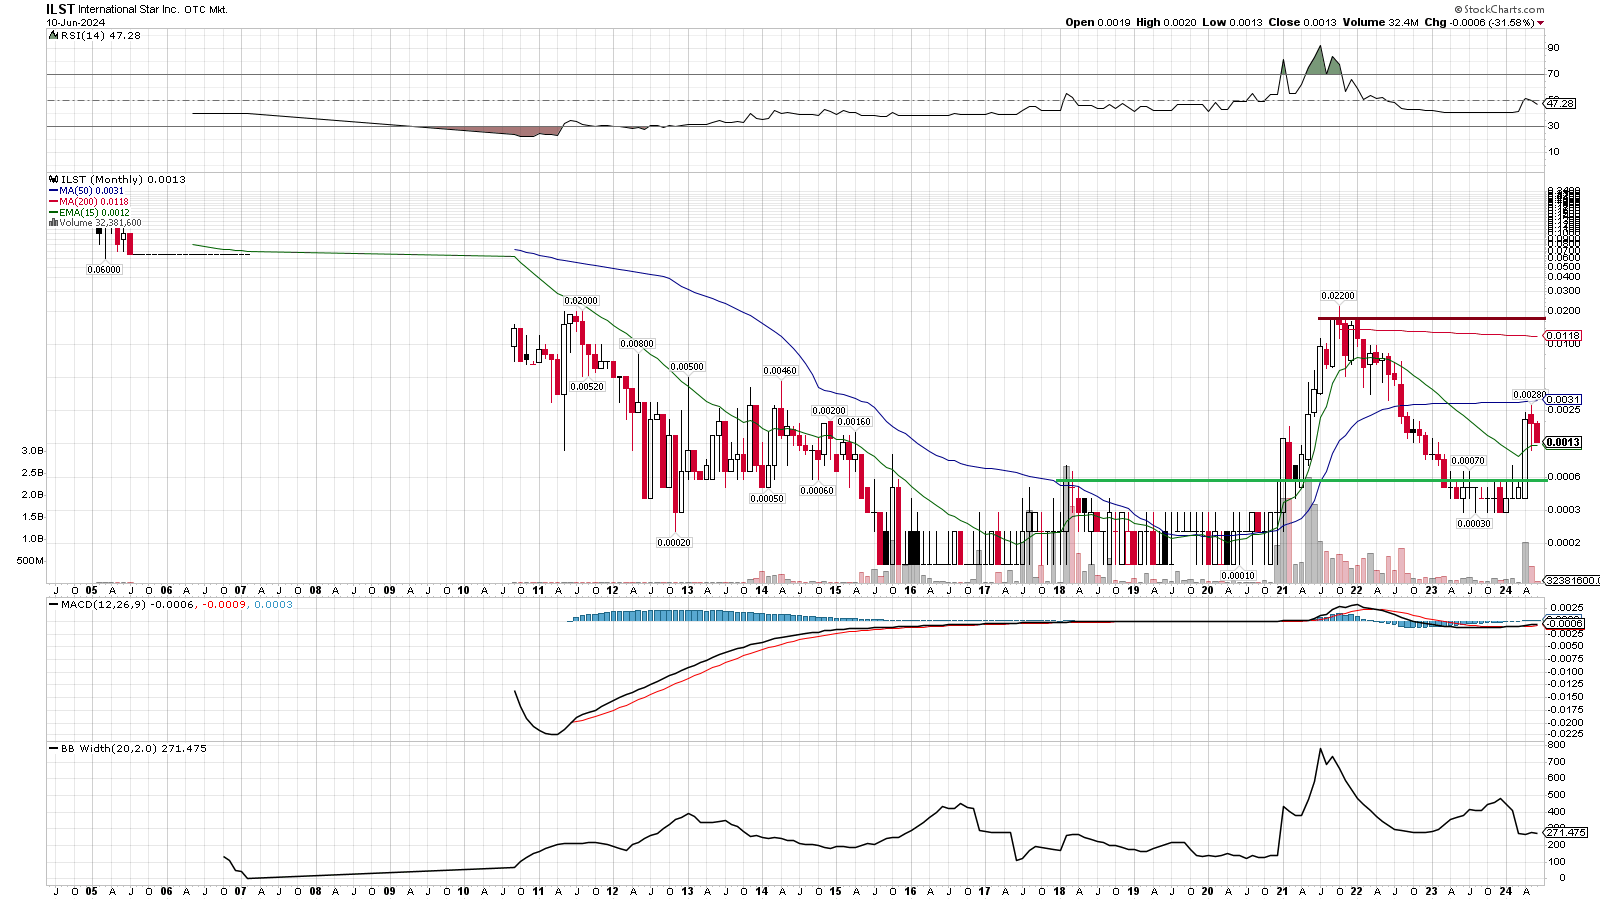
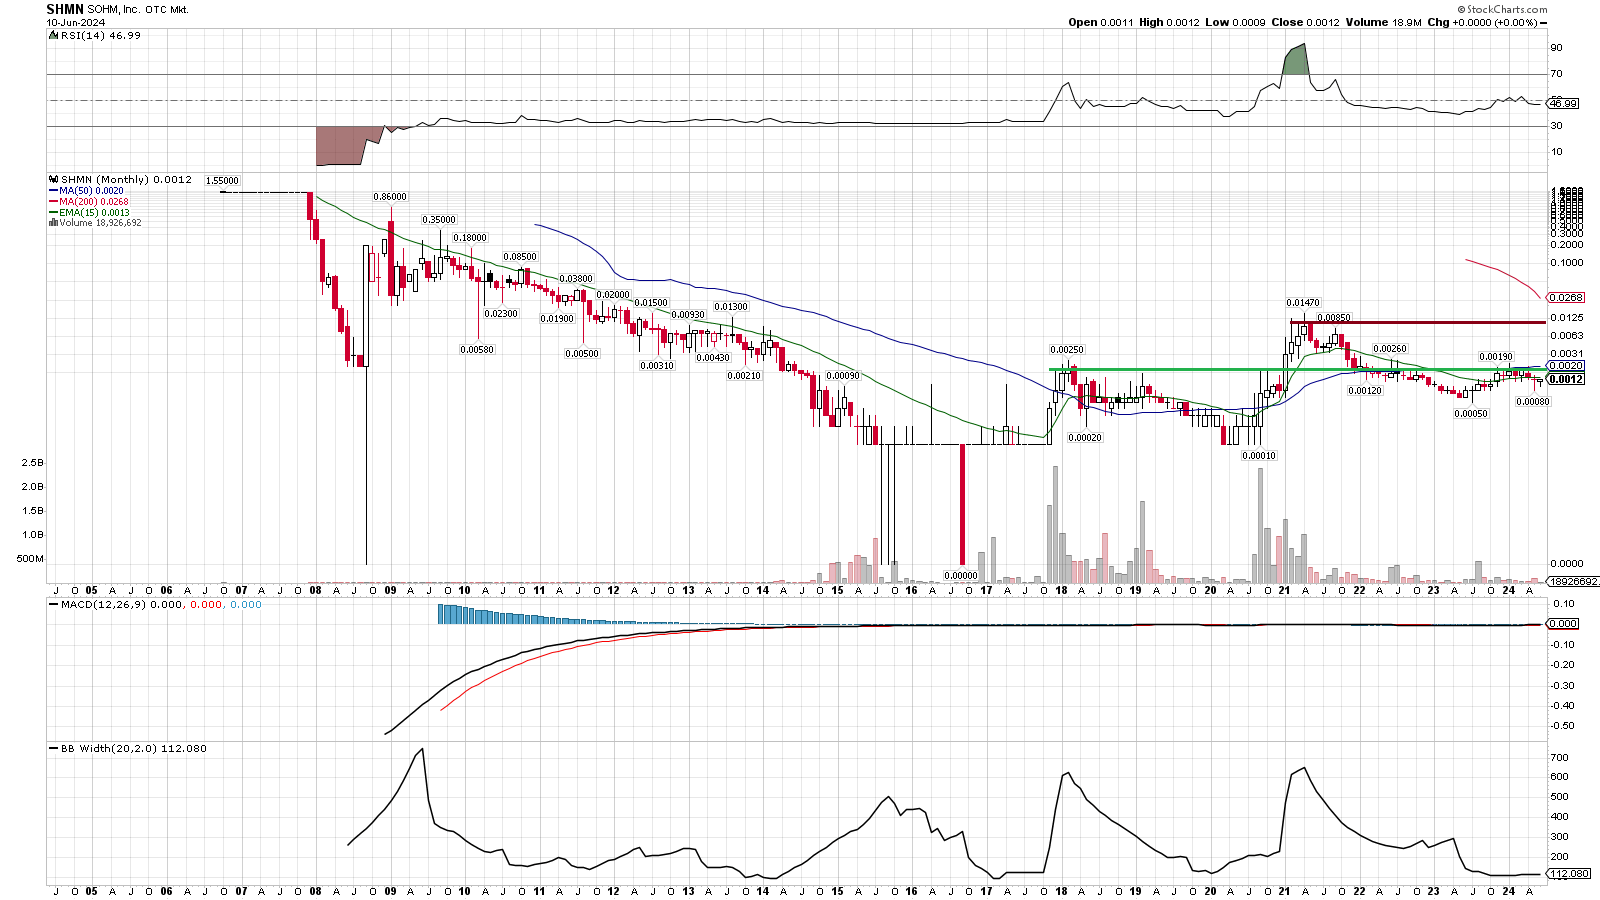
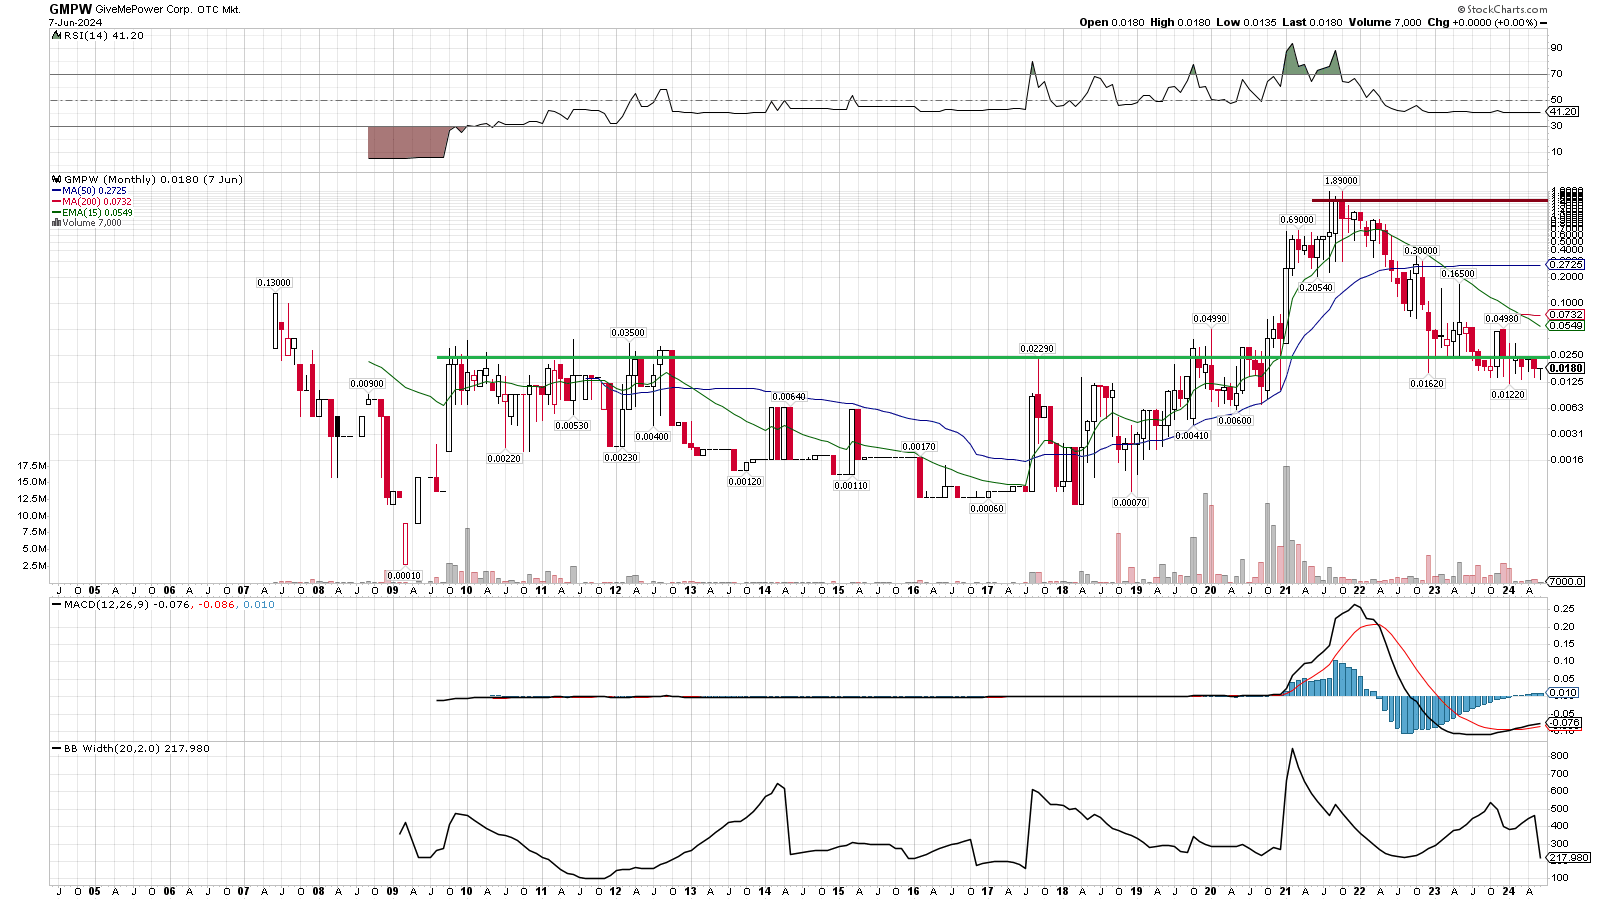
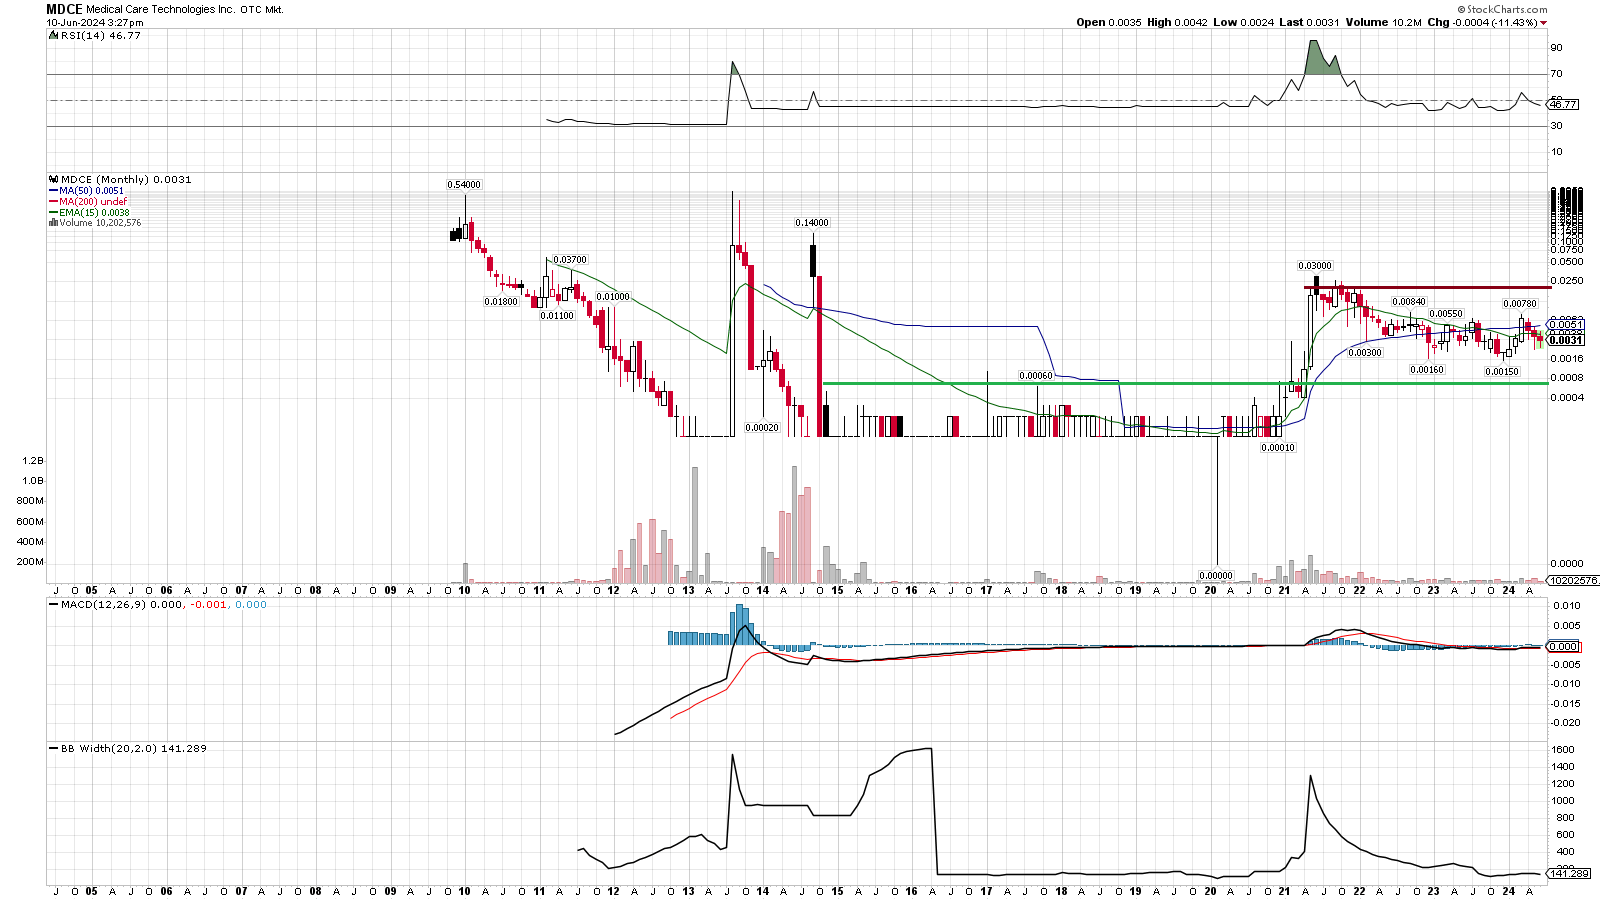
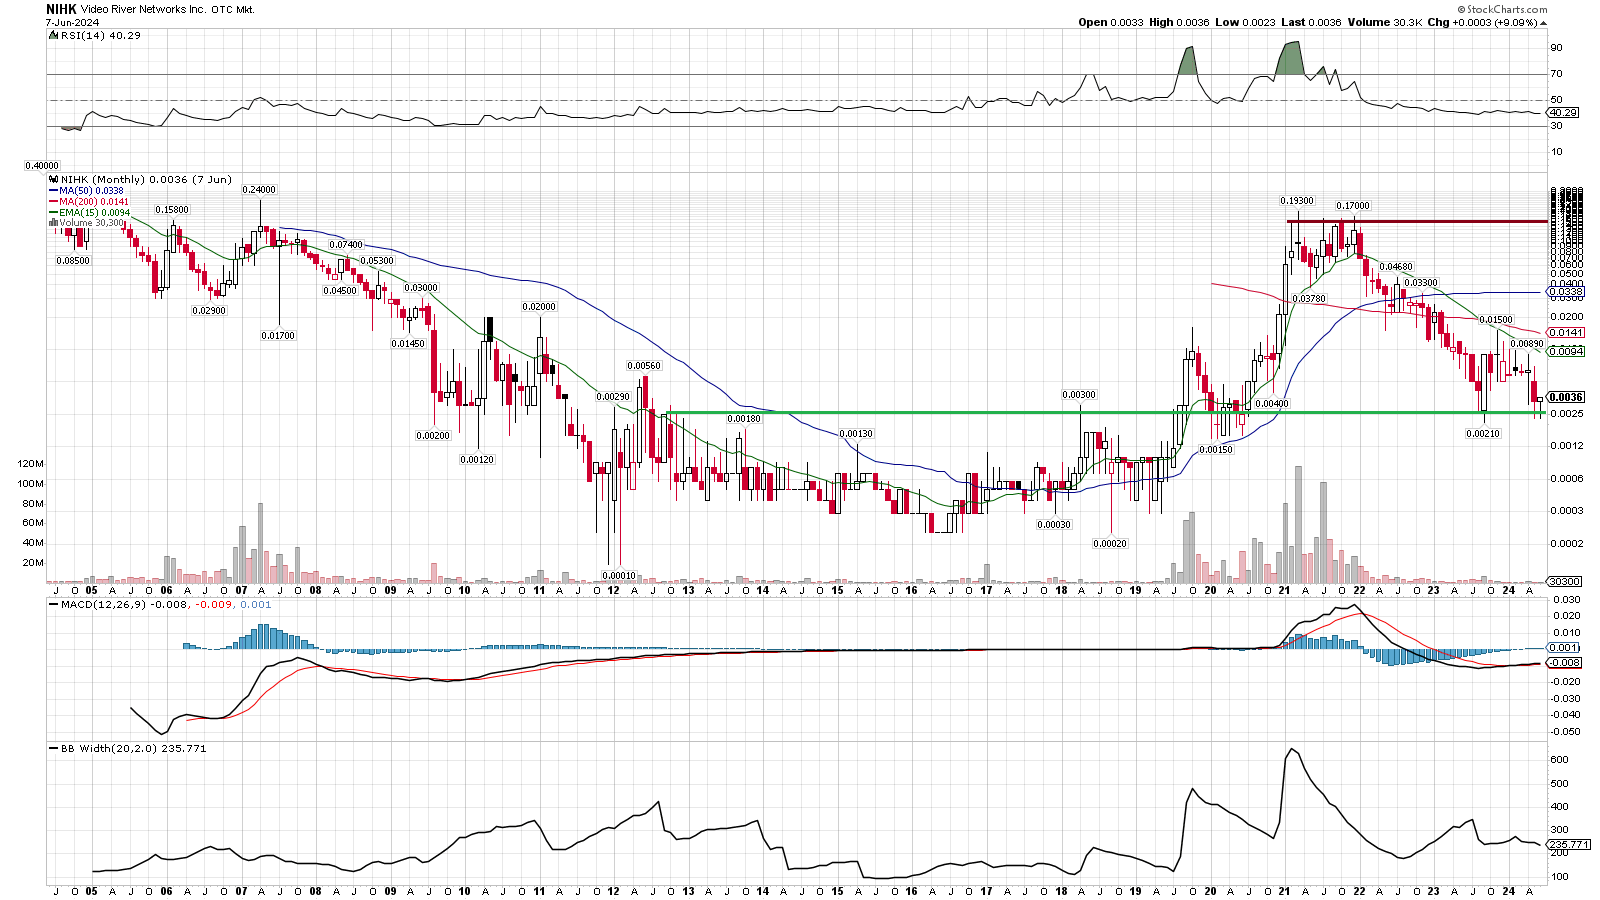
Green line = prior secular ceiling which was initially broken through, initiating a long term bullish breakout trigger; old ceiling becomes a new floor
Red line = current long term ceiling and target for the next secular bullish trigger; the nearer the prices get to their respective red line, the closer they are to testing a major breakout/continuation signal
To overly simplify, green line ranges should be stout long term support levels, red lines are significant long term breakout trigger levels. A temporary dip below the green lines may be a good buying opportunity, but if the action gets buried underneath it then it potentially turns back into strong resistance again. Ideally old ceilings become new floors.
The main objective more or less is to test, break then hold above the red lines. Notice which ones currently are the closest to their red lines? Notice a couple that have already broken above their red line?